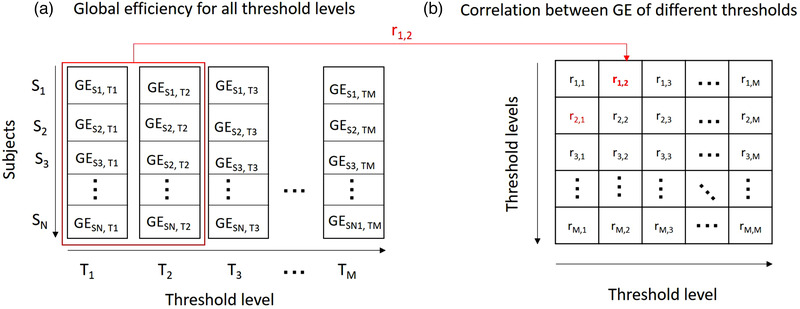
FIGURE 2.

Correlation matrix of global efficiency values of different thresholds. (a) First, for each threshold level (T), z‐scores of global efficiencies (GE) were calculated for all subjects (S). Then, to examine whether the inter‐individual variation changes between threshold levels (e.g., level 1 and 2), we calculated the Pearson correlation coefficient between global efficiency of those threshold levels (r1,2), resulting correlation matrix containing correlations between all pairs of threshold levels. (b) Correlation coefficients were calculated for all combination of thresholds, resulting in a correlation matrix. Note that this matrix is symmetric since r1,2 = r2,1
