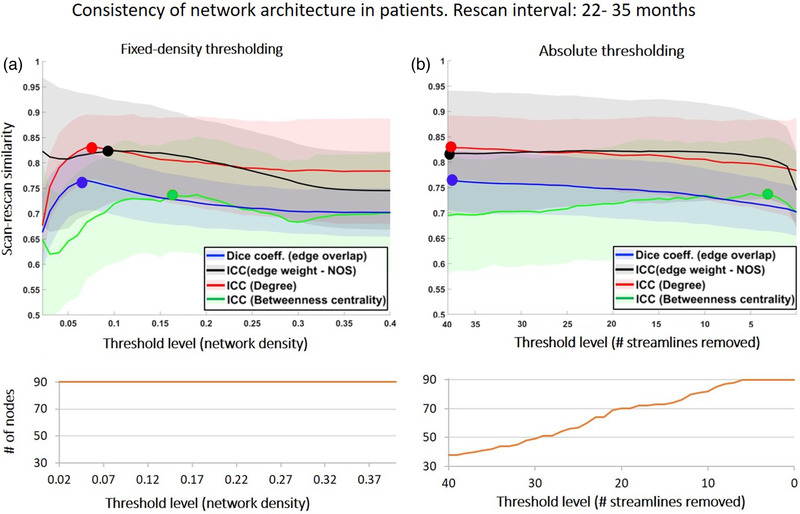
FIGURE 3.

Consistency of network architecture between scan and rescan in patients (rescan interval = 22–35 months). In each plot, the x‐axis represents the threshold level, with the strength of thresholding increasing from right to left. Note that for the fixed‐density approach the stronger the threshold the lower the density, whereas for the absolute approach, the stronger the threshold, the higher the number of streamlines removed. The curve in orange under each plot shows the number of nodes that remain in the network after thresholding. The initial number of nodes for the unthresholded network was N = 90 nodes. Blue: dice similarity of edges, black: ICC of edge‐weights; red: ICC of degree; green: ICC of betweenness centrality. The markers highlight maximum value in each curve, and the shaded areas represent the standard deviation
