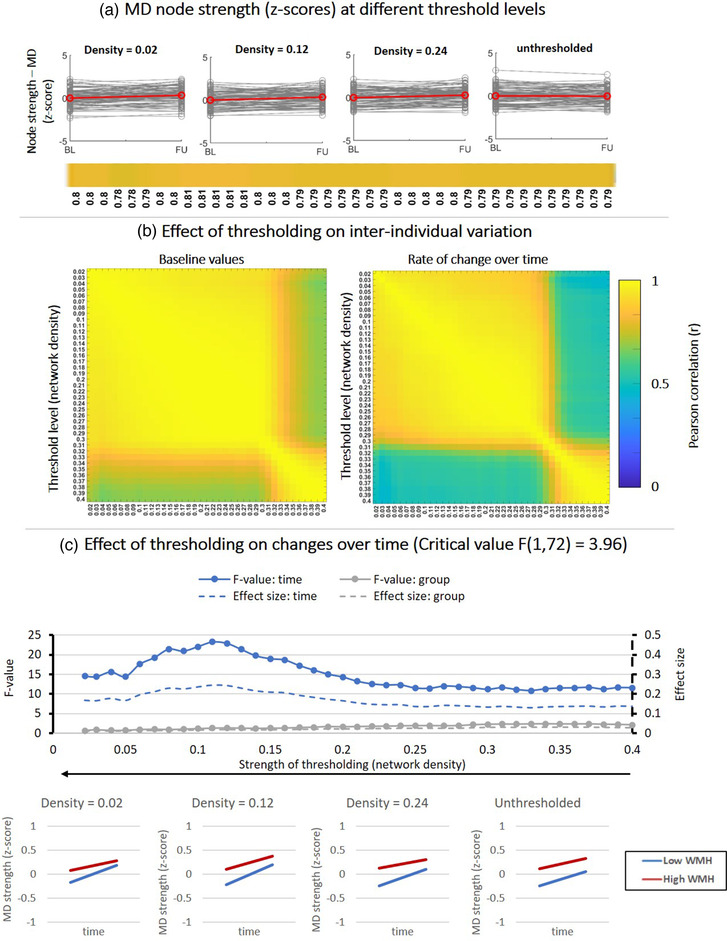
FIGURE 5.

Effect of fixed‐density thresholding on MD‐weighted node strength. (a) Baseline and follow‐up z‐scores for different threshold levels. The horizontal color bar shows correlations between baseline and follow‐up scores within each threshold level. (b) (Left) Correlation matrix containing Pearson correlations coefficients between baseline scores of different threshold levels. (Right) Correlations between rate of change over time obtained at different threshold levels. (c) Impact of thresholding on the sensitivity to detect changes over time and group‐differences in patients stratified by WMH volume. (Top) F‐values and effect sizes for the effect s of time (blue), group (gray), interaction term (orange). (Bottom) Average change over time in MD‐weighted strength for patients with low vs. high WMH volume
