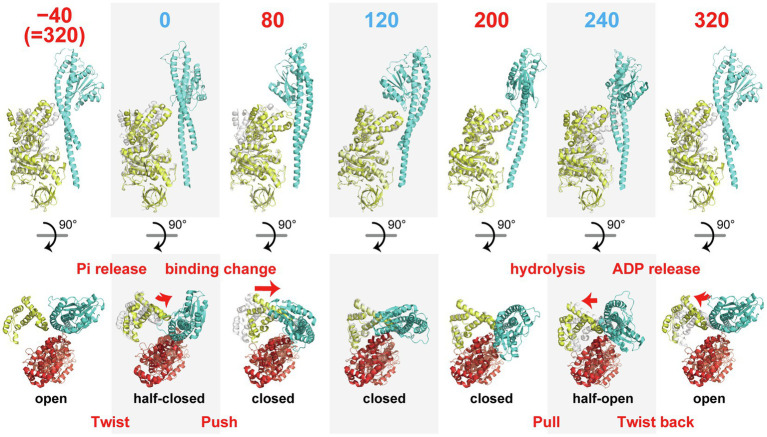
Figure 2.
Sequential images of the conformational states of the β subunit. αβ-pairs are superimposed on the N-terminal domain (β2-82) of the β subunit. The upper row shows the conformations of a pair of β (yellow) and γ subunits (cyan) viewed from the side. The numbers indicate the angle position of the γ subunit along the reaction scheme in Figure 1A where 0° is defined as the angle for ATP association. The lower row represents the positions of the C-terminal domains (after P356) of the β subunit (yellow) with the α (red) and γ subunits (blue) viewed from the top. The gray portion shows the structure of the β subunit before one reaction state for comparison purposes.

