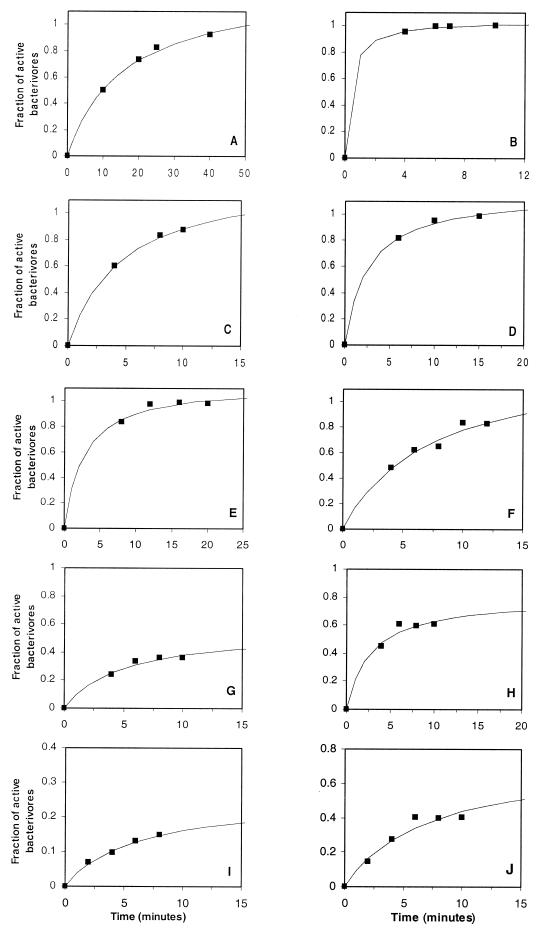
FIG. 2.
Ten representative examples of the fraction of active bacterivorous nanoflagellates versus incubation time. Saturating curves fitting the plotted data are also shown. Samples of experiments were from the Butron River (Spain) (panels A to D) and from Sapelo Island (panels E to J). Results presented in panels G and I were from samples inoculated with <0.6-μm-diameter FLB, and panels H and J represent the corresponding experiments with FLB made from the whole natural bacterial community. All other experiments were performed with FLB prepared from the whole natural bacterial population.

