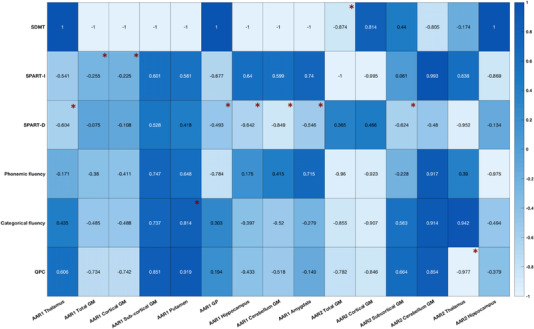
FIGURE 4.

Correlations (Pearson's coefficient “r”) between the AAR of different brain regions and cognitive assessment findings. The “*” indicates a p value < .05.
Abbreviations: AAR1, AAR during the first two years of NTZ therapy; AAR2, AAR during the third and fourth years of treatment; SPART‐D, SPART delayed recall; SPART‐I, SPART immediate recall
