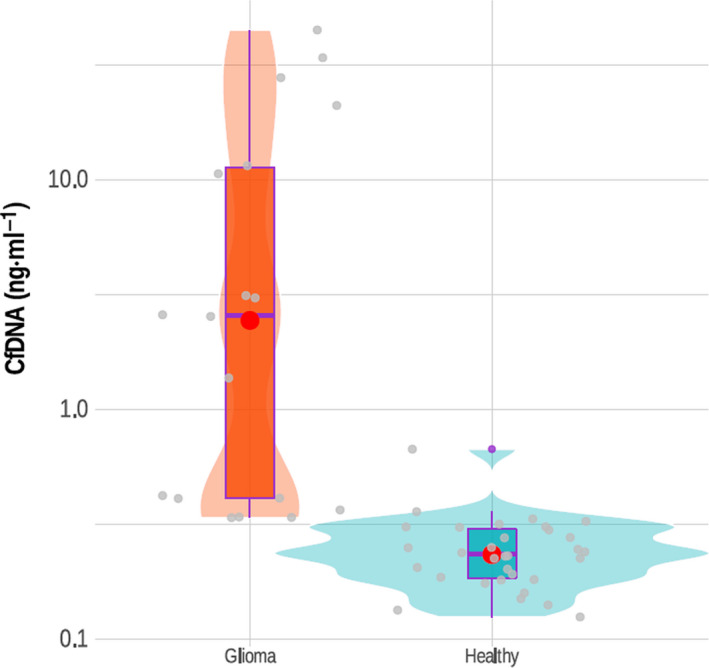
Fig. 2.

Quantification of cfDNA concentration in GBM patients vs healthy controls. The concentration of cfDNA isolated from 25 plasma samples of GBM patients was measured as described in the materials and methods. Violin plots represent 25 samples of patients vs 25 healthy controls cfDNA concentrations. The boxplots represent the confidence intervals for the samples vs controls; the red dots represent the median for both groups.
