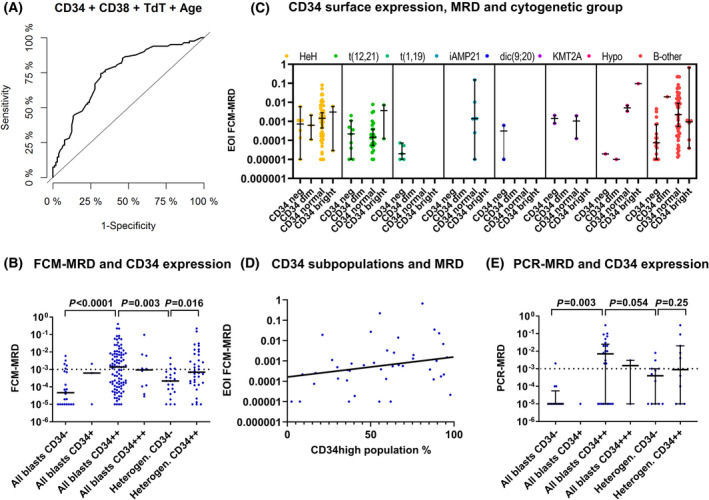
Fig. 1.

CD34 surface expression and minimal residual disease. (A) Receiver operating characteristic curve with end of induction MRD level > 10−3 as outcome and with CD34, CD38, nTdT, and patient age at time of diagnosis as predictors showing an AUC of 0.75 (CI 0.68–0.82, n = 185). (B) CD34 surface expression and end of induction (day 29) MRD level measured by flow cytometry (n = 191). Grouping patients with heterogeneous CD34 expression by the score of the dominant subpopulation yields equal distributions among uni‐ and bimodal cases with regard to EOI MRD. Line represents median level. Horizontal dashed line refers to the end of induction stratification level in the NOPHO ALL2008 protocol. P‐values from Mann–Whitney U test. (C) End of induction MRD level and CD34 surface expression, by cytogenetic subgroup (n = 191). The CD34 expression is illustrated as a combined score, where cases with bimodal and unimodal expression were pooled according to the score of the dominant subpopulation in cases with bimodal expression and the score of the whole population in cases with unimodal expression. (D) Association between end of induction MRD level and the relative distribution of CD34 subpopulations (n = 42). In one case, both populations were CD34‐positive and so the CD34‐positive population was set to 100%. (E) CD34 surface expression and end of induction MRD measured by PCR (n = 65). Lines represent median and IQR. Horizontal dashed line refers to the end of induction stratification level in the NOPHO ALL2008 protocol. P‐values from Mann–Whitney U test. EOI, end of induction; FCM, flow cytometry; IQR, interquartile range; LOD, limit of detection; MRD, minimal residual disease; NOPHO, Nordic Society of Pediatric Hematology and Oncology.
