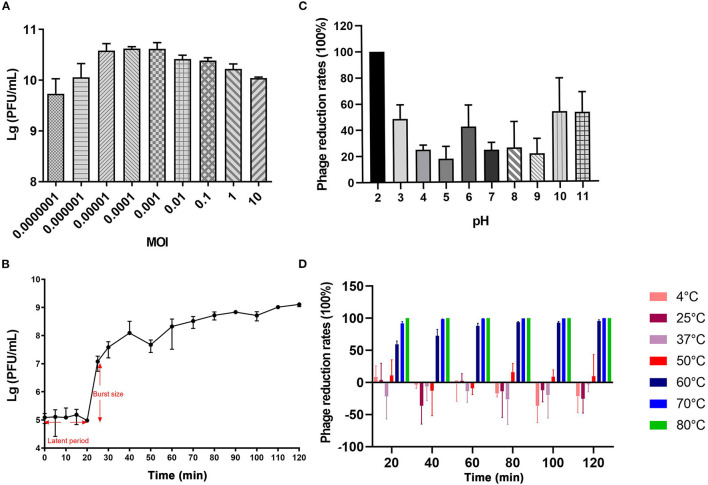
Figure 2.
Growth characteristics and stability tests of vB_CbrM_HP1. (A) The optimum MOI of phage vB_CbrM_HP1. The titer of vB_CbrM_HP1 at nine different multiplicities of infection (MOIs) at 7 h at 37°C with 180 rpm/min. (B) The one-step growth curve of phage vB_CbrM_HP1. When the MOI was 0.1, the titer of vB_CbrM_HP1 changed within 2 h. (C) The pH stability of phage vB_CbrM_HP1. The reduction rates of vB_CbrM_HP1 in SM buffer of different pH (2–11) values for 2 h at 37°C. (D) The temperature stability of phage vB_CbrM_HP1. The reduction rates of vB_CbrM_HP1 at different temperatures (4–80°C) over 2 h. The means and standard deviations are represented as points with error bars (n = 3).

