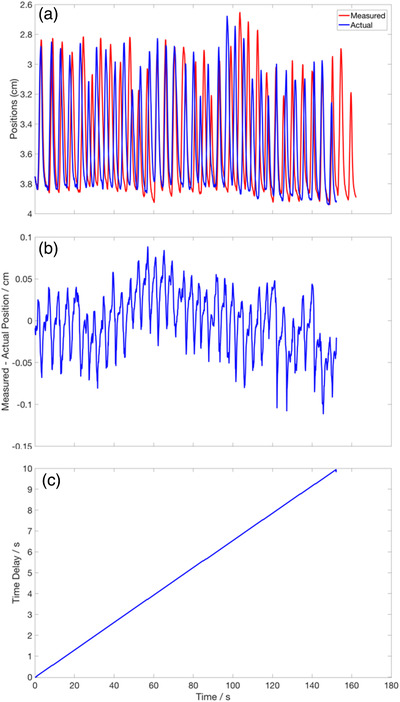
FIGURE 3.

Positional and temporal accuracy of the 2D Motorized stages. (a) A plot of the actual (in blue solid line) and measured (in red solid line) positions of the motorized stage using an actual patient breathing curve. (b) The positional difference between the measured and actual breathing curve. (c) The cumulative time delay in the measured signal over the entire run‐time. The delay is calculated to be 0.0655 s per second of run time (gradient of the line)
