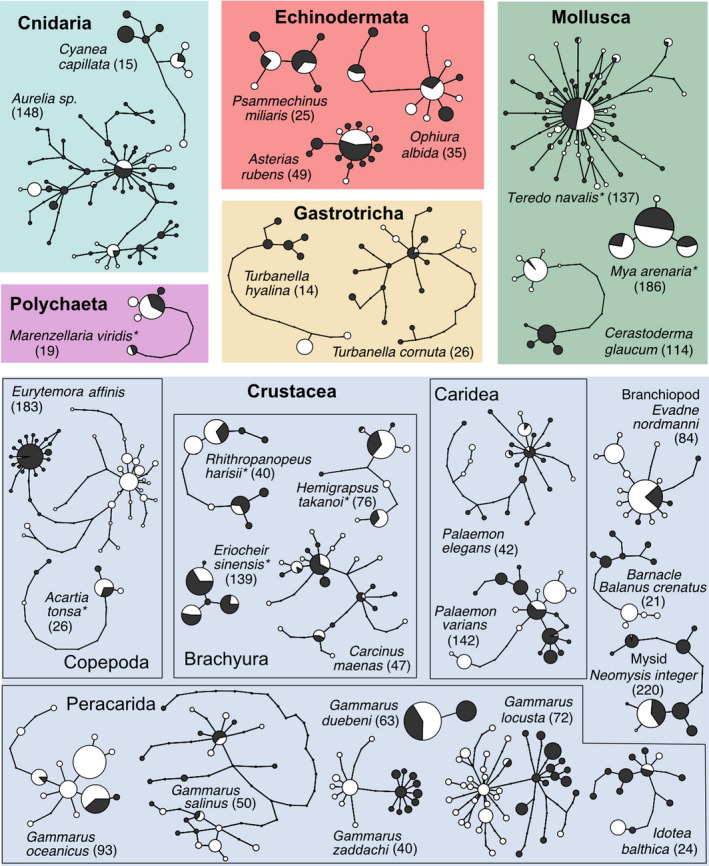
FIGURE 2.

Haplotype networks for all 28 investigated species grouped by taxonomic affinity. Size of the circles is relative to the sample size, but not the same between species. Colors of the circles denote populations: black = North Sea, white = Baltic Sea, and asterisks denote non‐native species. Background colors distinguish between higher taxa. Overall sample size n in parentheses
