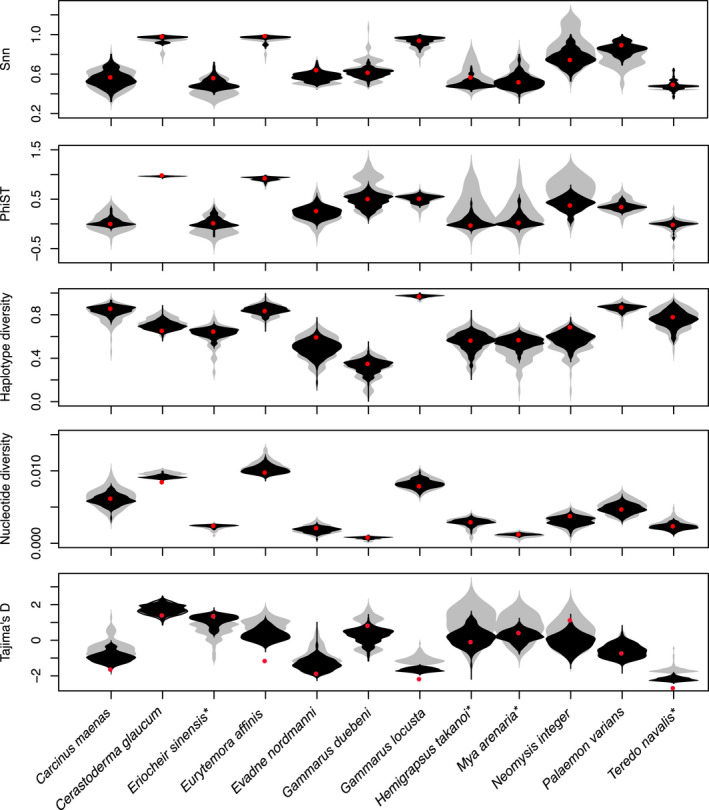
FIGURE 4.

Population genetic rarefaction results for all species with more than 20 sequences per population. Red dots represent the point estimate based on the full dataset; gray violin plots, the distribution of estimates based on five random sequences per population; and black violin plots the distribution of estimates based on 10 random sequences. Asterisks denote non‐native species
