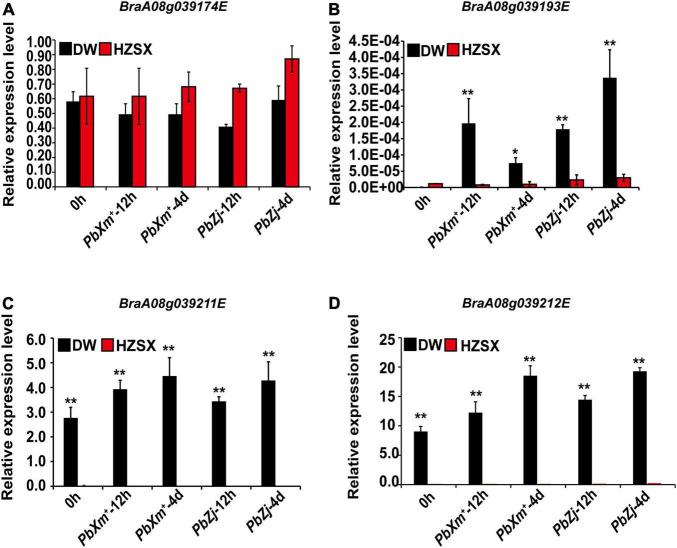
FIGURE 5.
Relative expression of candidate CR genes between DW (black) and HZSX (red) before and after inoculation of PbXm+ and PbZj isolates. (A–D) Relative expression of homologs of BraA08g039174E, BraA08g039193E, BraA08g039211E, and BraA08g039212E, respectively. ** represents p ≤ 0.01 by Student’s t-test.

