Figure 1.

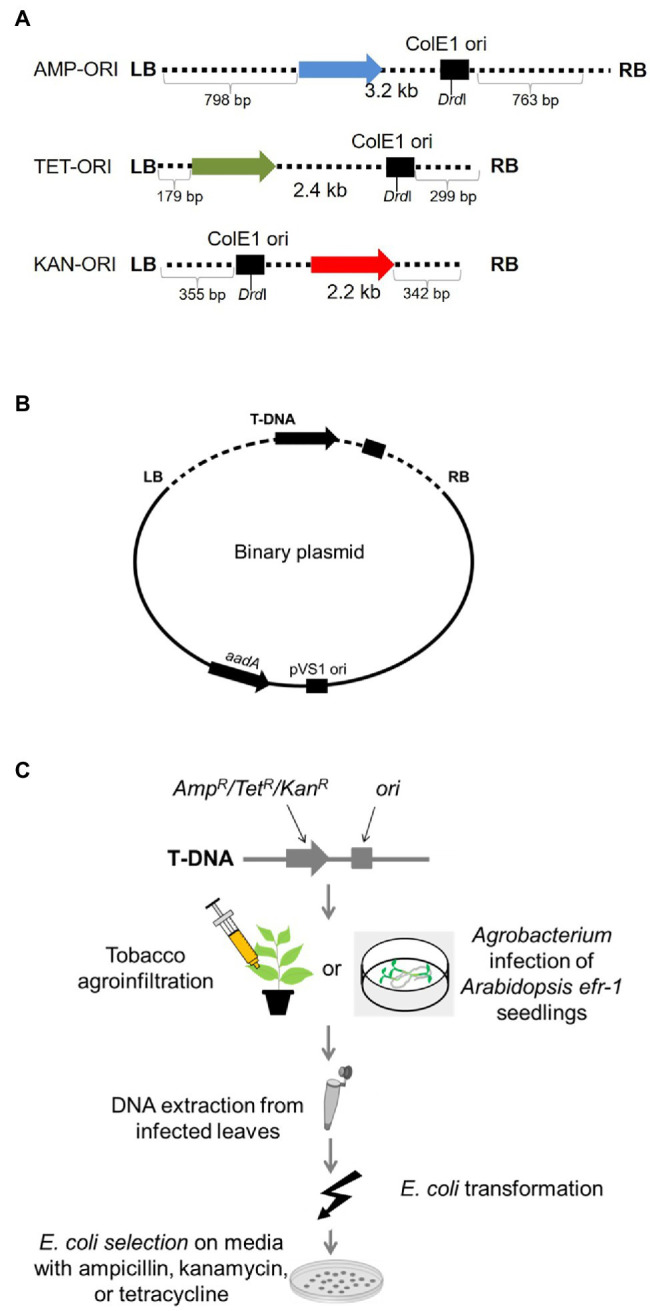
T-circle isolation using “simple” T-circle binary vectors. (A) Schematic diagram of the T-DNA regions of the various T-DNA binary vectors. AMP, TET, and KAN indicated genes encoding ampicillin, tetracycline, and kanamycin resistance, respectively. ORI indicates the ColE1 origin of replication. LB and RB indicate T-DNA left and right borders, respectively. (B) T-DNA binary vectors used in these experiments. aadA indicates a gene encoding spectinomycin resistance. pVS1 ori indicates the origin of replication of the plasmid in Agrobacterium. (C) Schematic diagram of the plant infection and T-circle isolation processes. Nicotiana benthamiana leaves are infiltrated or Arabidopsis seedlings are co-cultivated with Agrobacterium tumefaciens EHA105 harboring one of the T-circle binary vectors. After 3–6 days, total DNA is extracted from the plant tissue and used to transform E. coli cells. Transformants are selected on medium containing the antibiotic corresponding to the resistance gene in the T-DNA region, then later counter-screened on medium containing spectinomycin. Spectinomycin-sensitive colonies are progressed for T-circle characterization.
