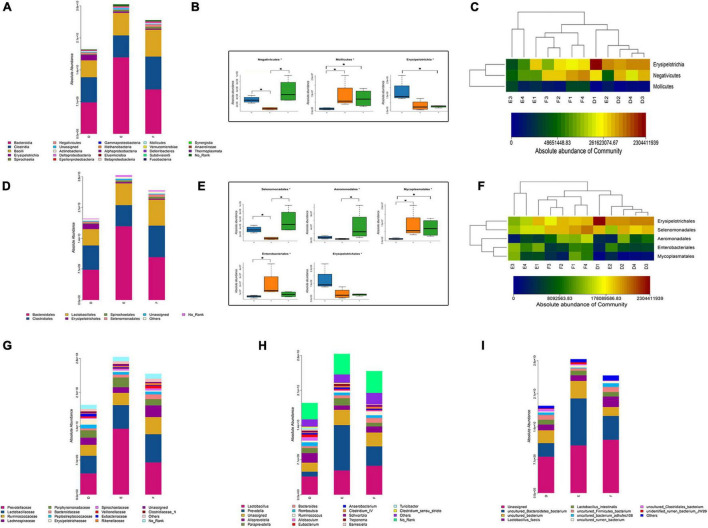
FIGURE 6.
Composition of the gut microbiota (n = 4/group): (A) the absolute abundance of major bacterial taxa at the class level; (B,C) significant different bacteria at the class level. The data were analyzed by one-way ANOVA (*p < 0.05); (D) the absolute abundance of major bacterial taxa at the order level; (B,C) significant different bacteria at the order level. The data were analyzed by Kruskal–Wallis (*p < 0.05); (G–I) the absolute abundance of major bacterial taxa at the family, genus, and species levels.

