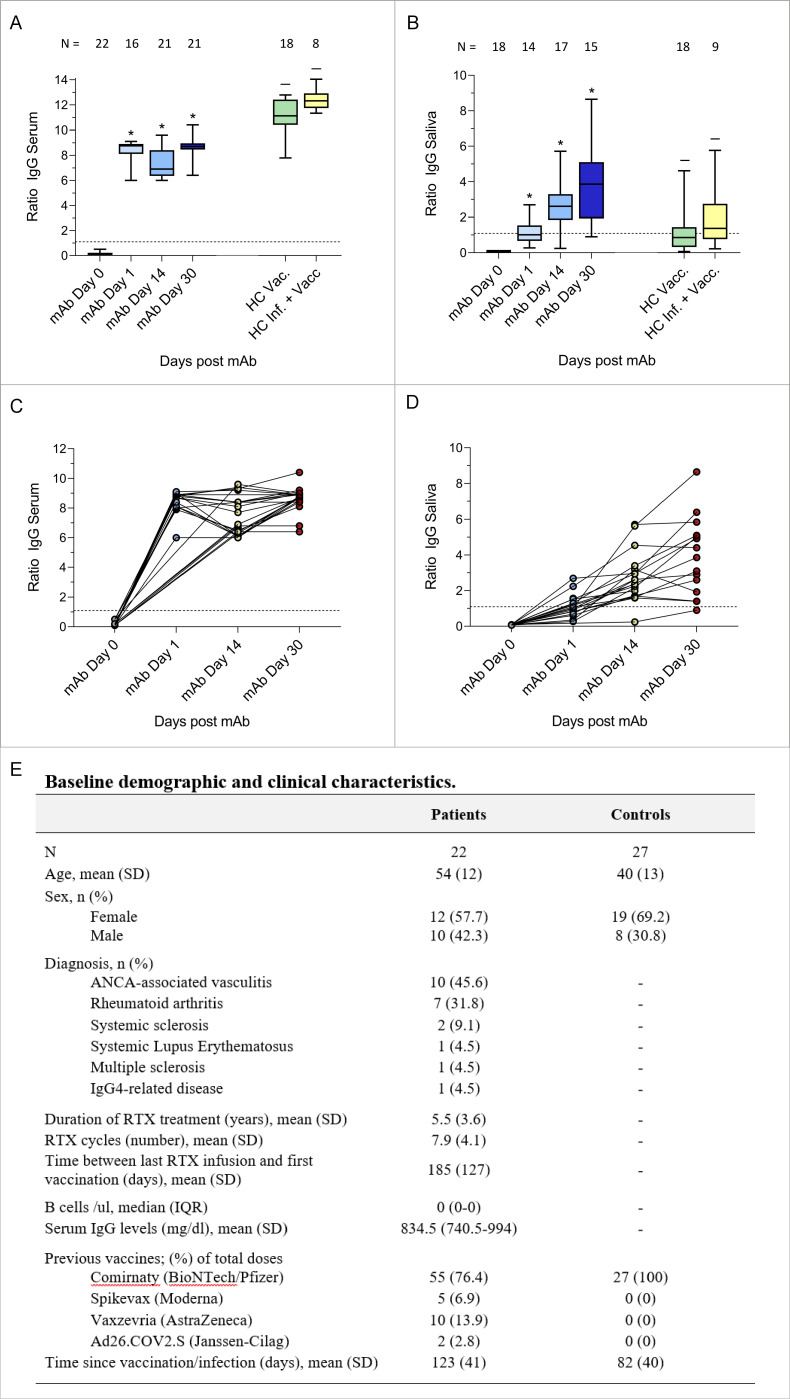
Figure 1.
Box and whiskers (top) and spaghetti plots (bottom) of the levels of serum (A, C) and salivary (B, D) anti-SARS-CoV-2 spike IgG antibodies before and after 1 day, 14 dayS and 30 days from casirivimab/imdevimab treatment. Serum and salivary anti-SARS-CoV-2 spike IgG antibody concentrations in healthy controls after SARS-CoV-2 vaccination (HC Vacc.), and after SARS-CoV-2 infection and vaccination (HC Inf.+Vacc.) are shown for comparison. Healthy controls were recruited from the general population and from healthcare workers. The number of subjects analysed for each timepoint is indicated in the figure. The dashed horizontal line represents cut-off values of 1.1 (anti-SARS-CoV-2 IgG negative/positive). *=p <0.0001 compared with day 0. –=p <0.0001 (A) and p<0.05 (B) compared with day 30 after pre-exposure prophylaxis. Baseline demographic and clinical characteristics of the patients and of the controls are reported in (E). ANCA, antineutrophil cytoplasmic antibodies; HC, healthy controls; mAb, monoclonal antibodies; RTX, rituximab.

