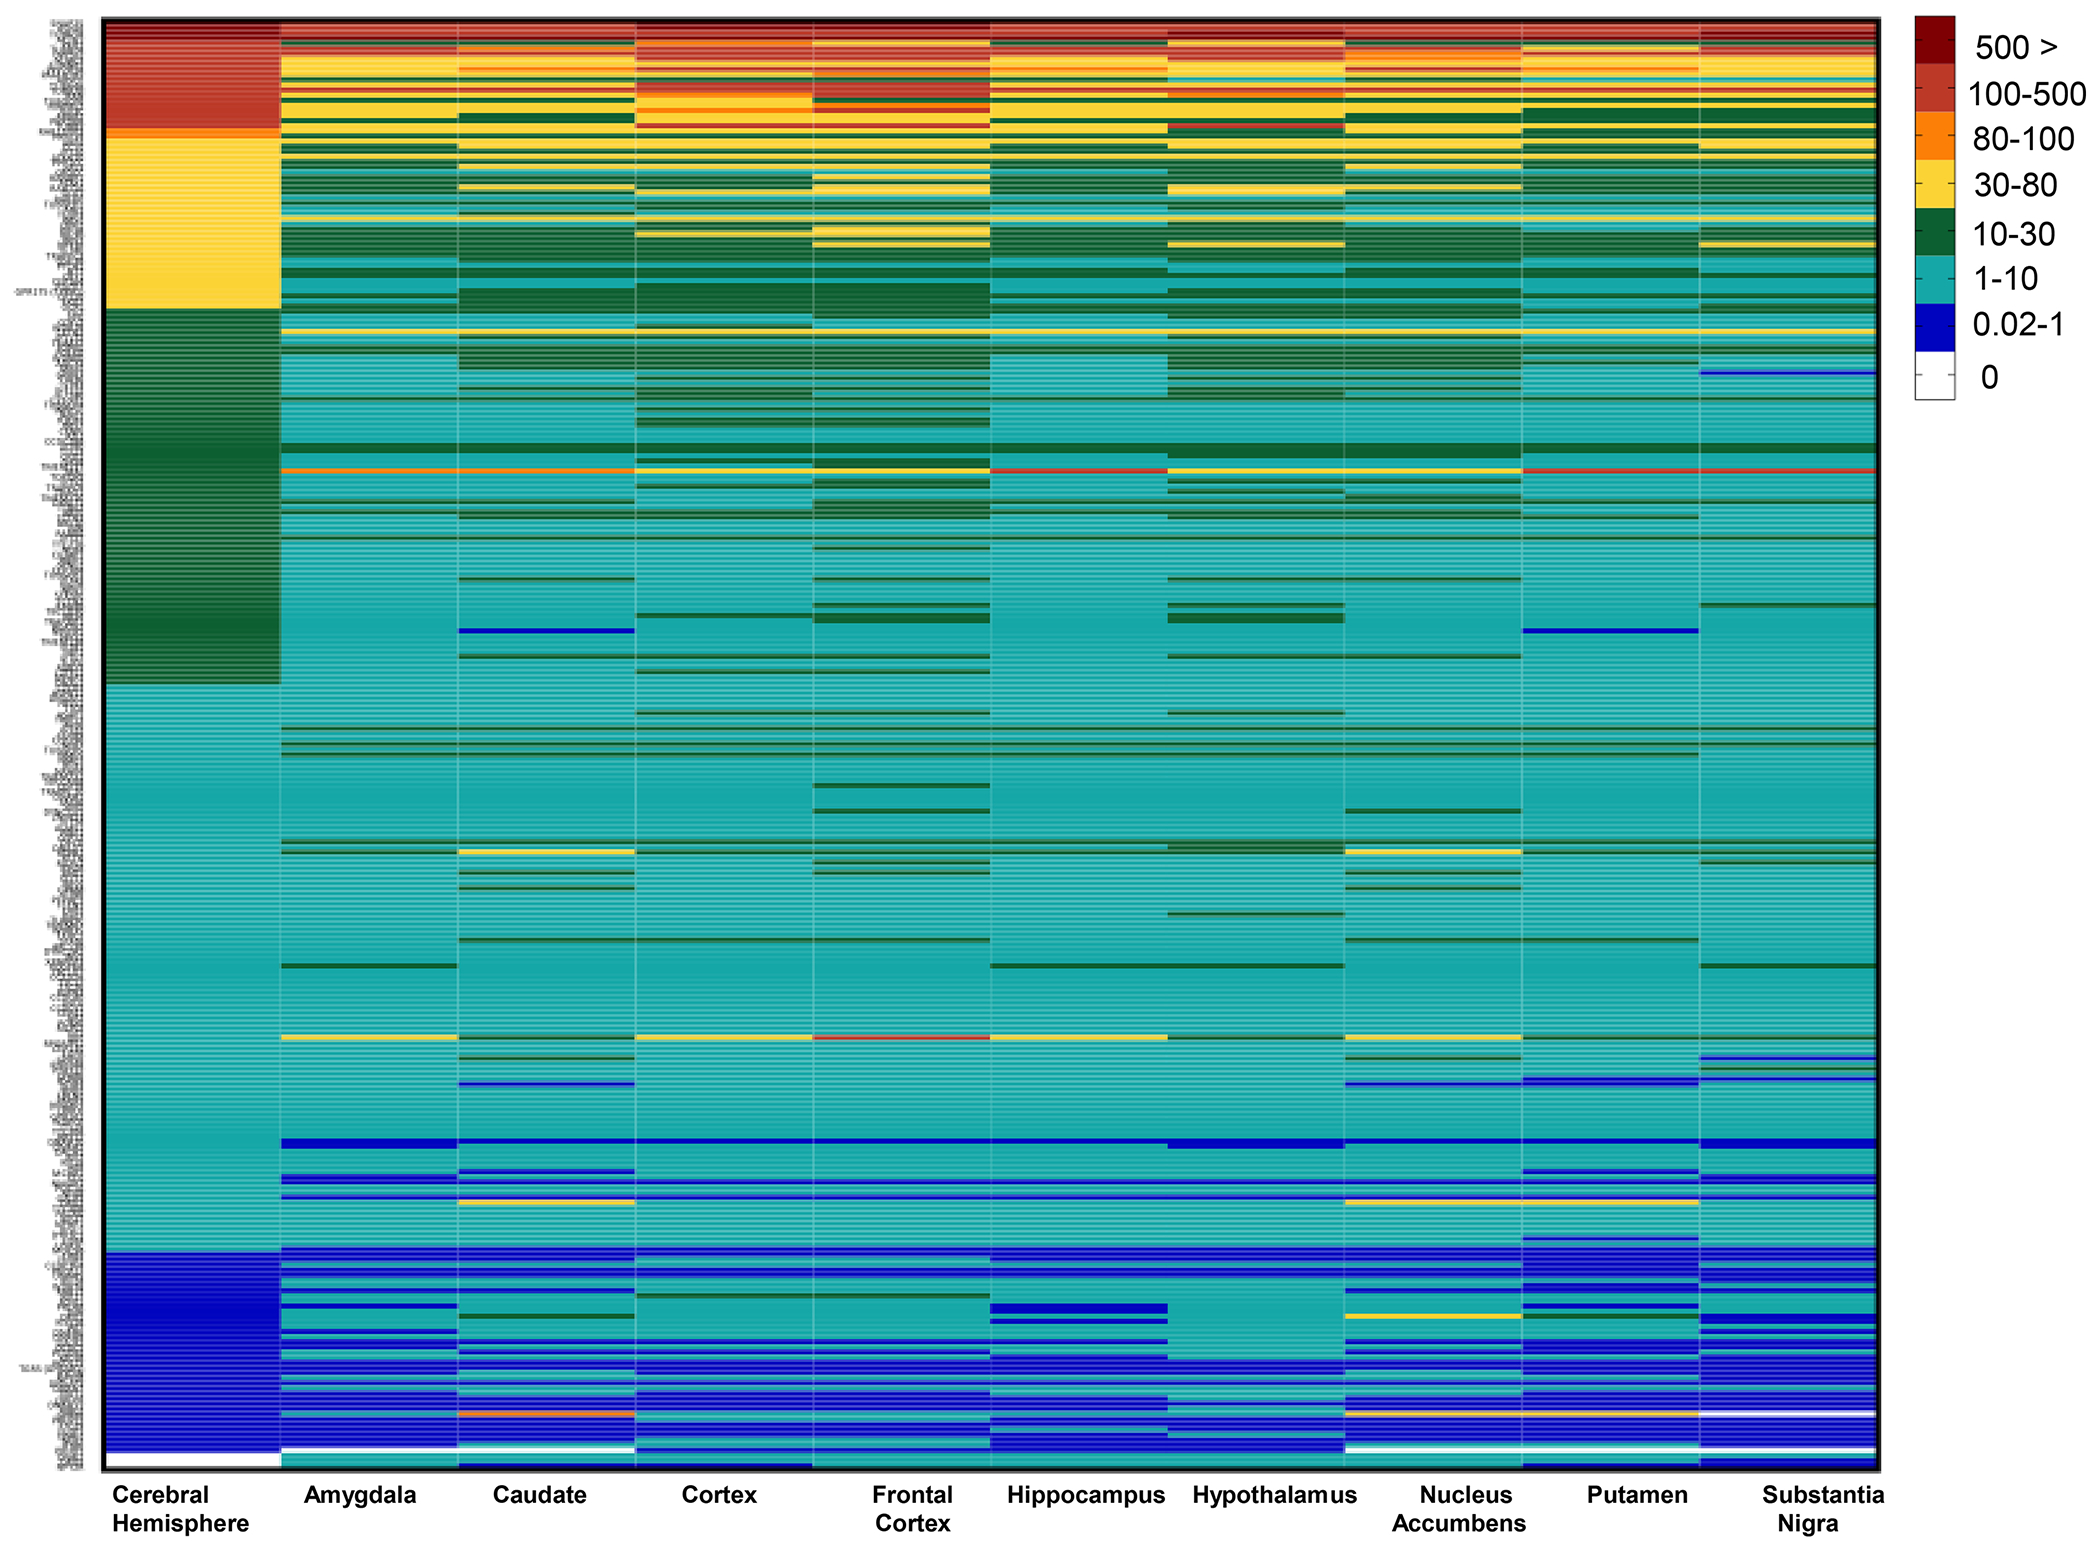
Figure 1. Identification of cilia gene expression across specific brain tissues in GTEx.

Heatmap of gene expressions of cilia genes in the GTEx brain tissues using median TPMs from the GTEx dataset. Columns denote brain regions and rows represent cilia genes. Genes are shown and categorized in median Transcripts Per Million (TPM).
