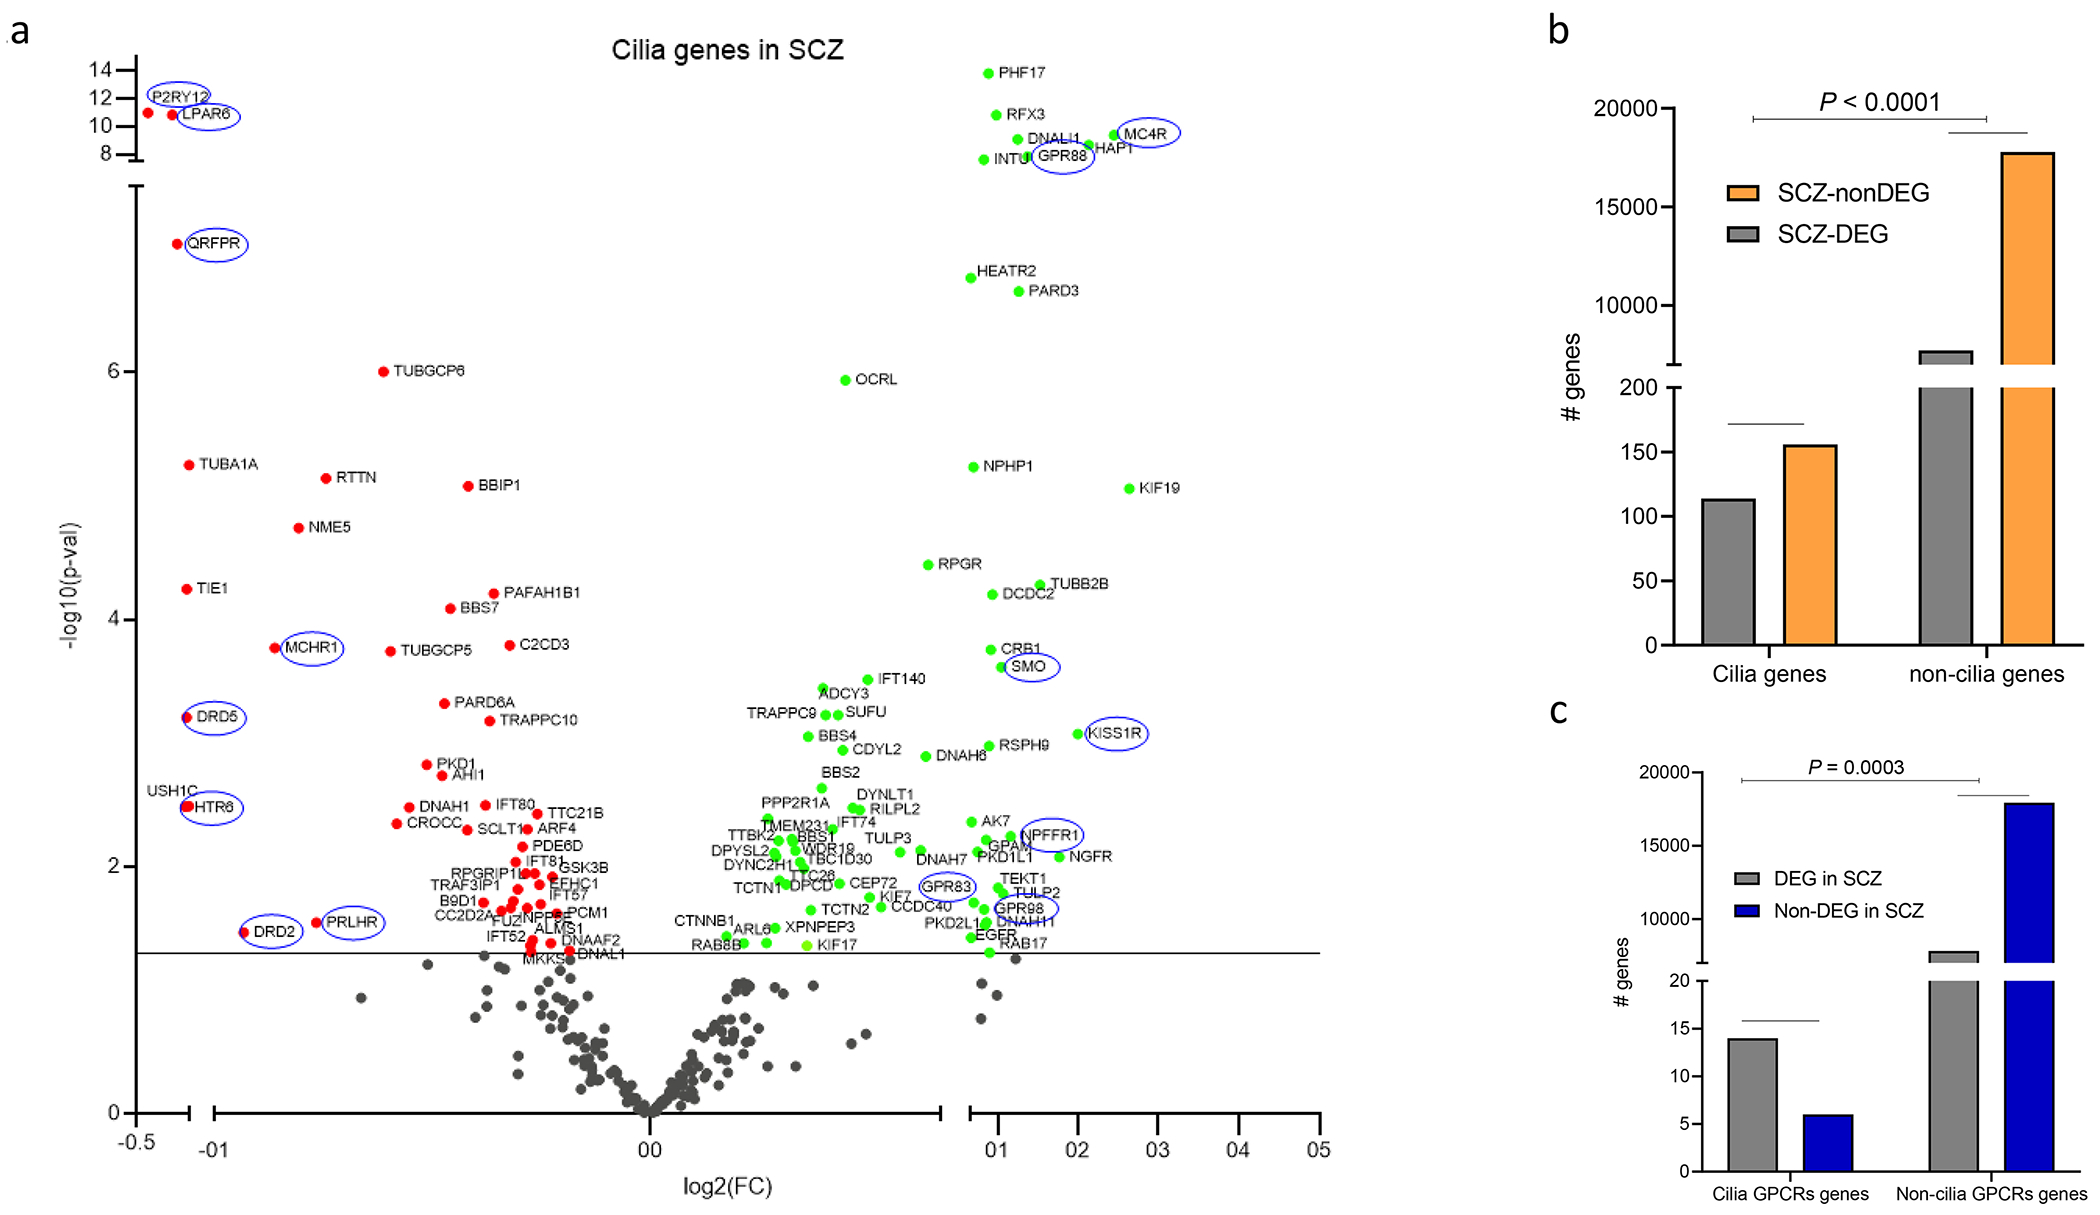
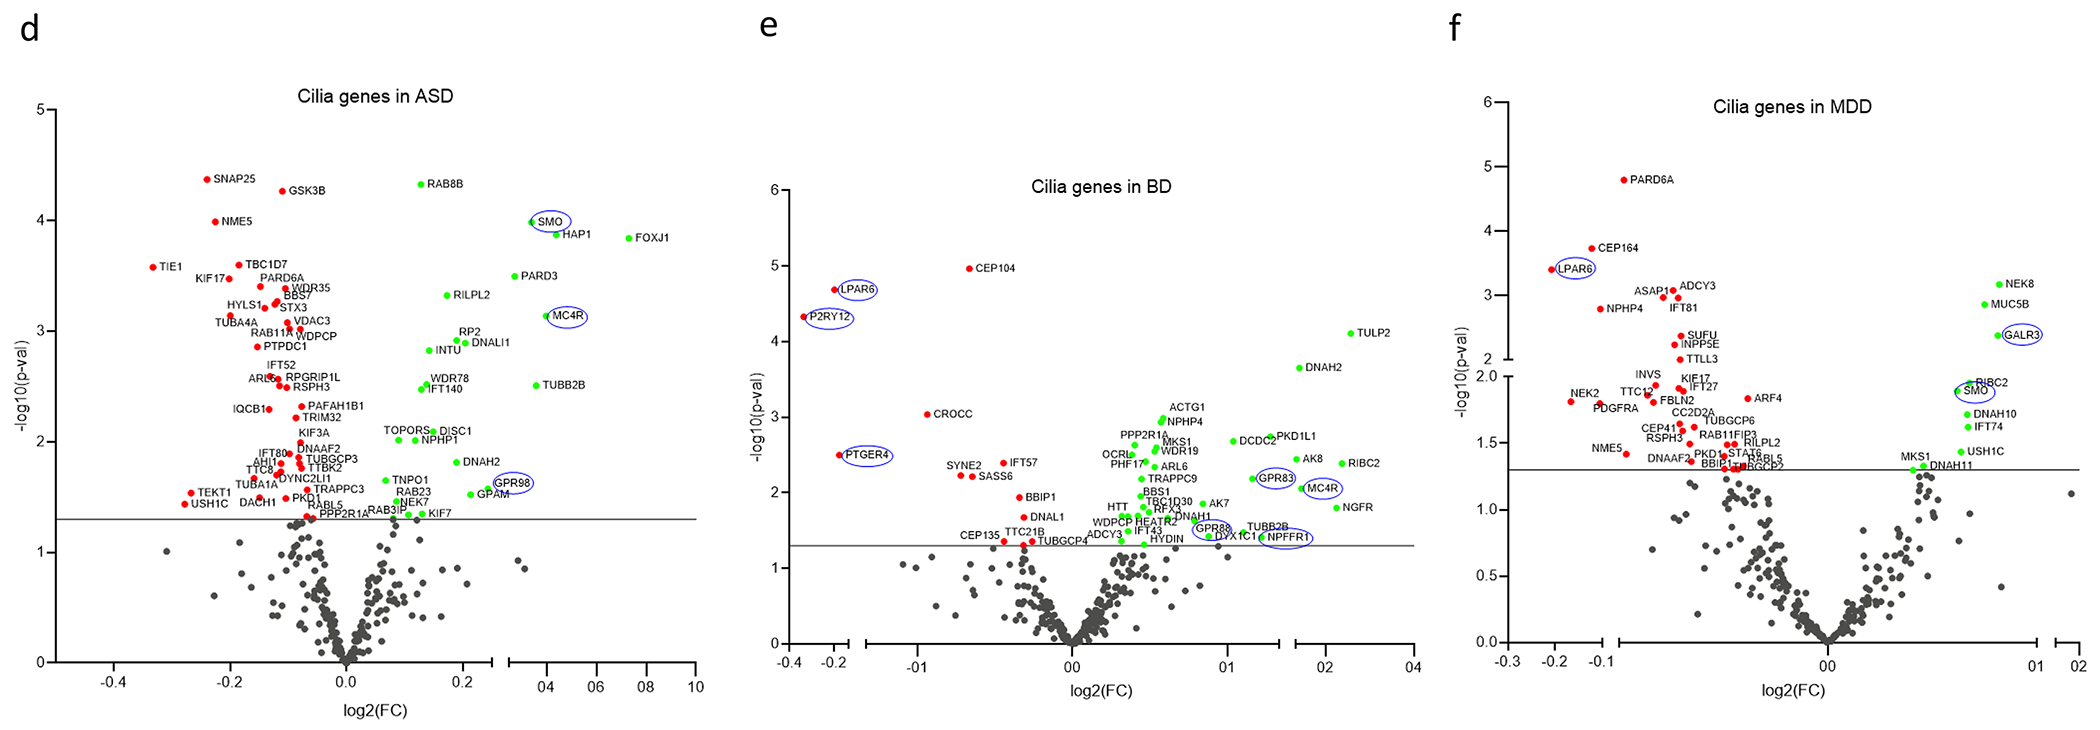
Figure 2. Cilia differentially expressed genes in SCZ, ASD, BP, and MDD.


a. Volcano plot showing DEGs (P <0.05). Scattered points represent cilia genes: the x axis is the fold change while the y axis is the -log p value. Green and red dots refer to upregulated and downregulated genes. Genes circled in blue represent GPCRs that localize to the cilium.
b. Histogram showing the cilia genes and non-cilia genes that are differentially expressed in SCZ; Exact Fisher test OR = 1.681, P < 0.0001.
c. Histogram showing cilia GPCR genes and non-cilia GPCR genes that are differentially expressed in SCZ; Exact Fisher test: OR: 6.873, P = 0.0001.
d-f. Volcano plots of cilia DEGs in (d) ASD, (e) BP, and (f) MDD.
