
Figure 3. Cilia DEGs overlap across the four psychiatric disorders.
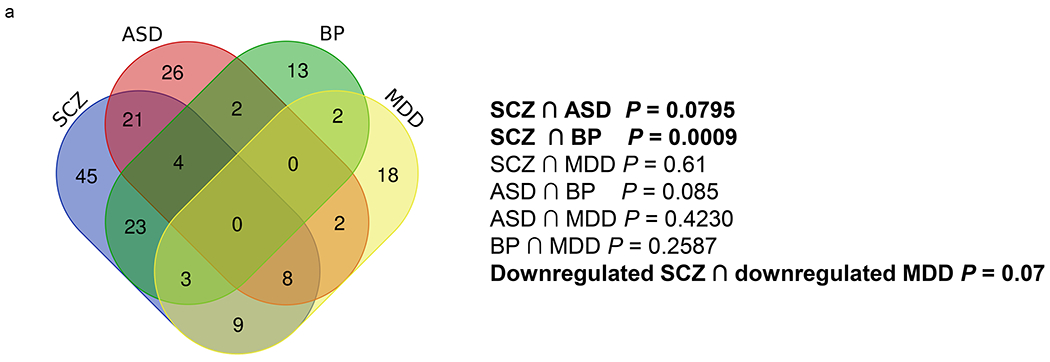
a. Venn diagram conveying overlap between significant DEGs (P<0.05) within 4 psychiatric disorders, SCZ, ASD, BP, and MDD.
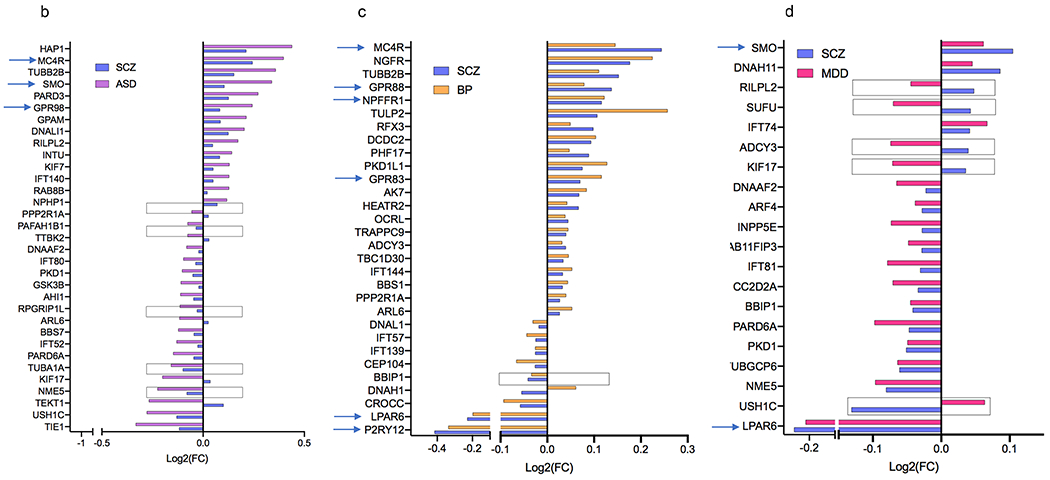
b-d. Cilia DEGs genes overlapping between SCZ with (b) ASD, (c) BP, (d) and MDD. Genes that are differentially expressed in opposing directions are denoted with a box. GPCRs are identified by arrows.
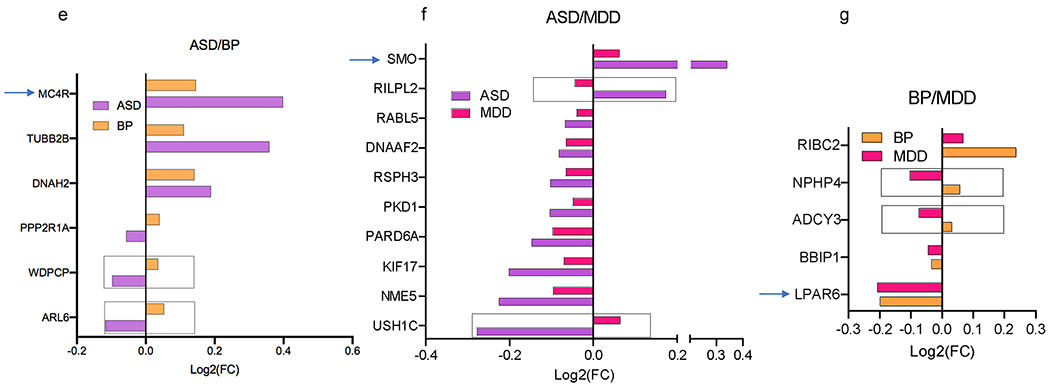
e-g. Overlap of DEG between two disorders: (e) ASD and BP, (f) ASD and MDD, (g) BP and MDD.
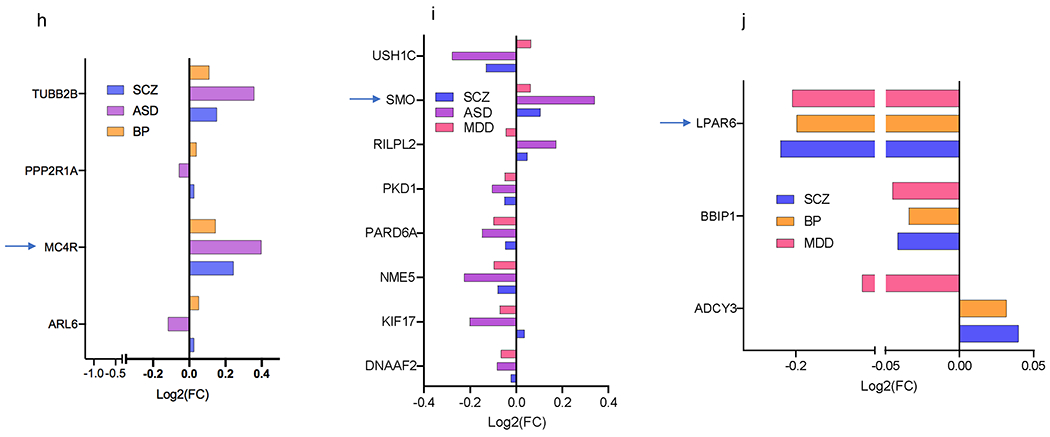
h-j. Overlap of DEG among three disorders: (h) SCZ, ASD, and BP, (i) SCZ, ASD, and MDD, (j) SCZ, BP, MDD. The x axis shows Log2FC and along the y axis are the cilia genes. Genes that are differentially expressed in opposing directions are denoted with a box. GPCRs are identified by arrows.