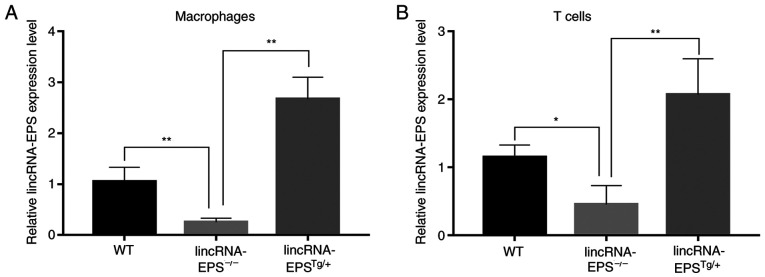
Figure 6.
Relative lincRNA-EPS expression levels shows that the animal models were successfully established. Relative lincRNA-EPS expression level of (A) macrophages and (B) T cells. n=6 independent experiments. *P<0.05 and **P<0.01 as indicated. lincRNA-EPS, long intergenic non-coding RNA-erythroid pro-survival; lincRNA-EPS-/-, lincRNA-EPS knockout; lincRNA-EPSTg/+, lincRNA-EPS overexpression.

