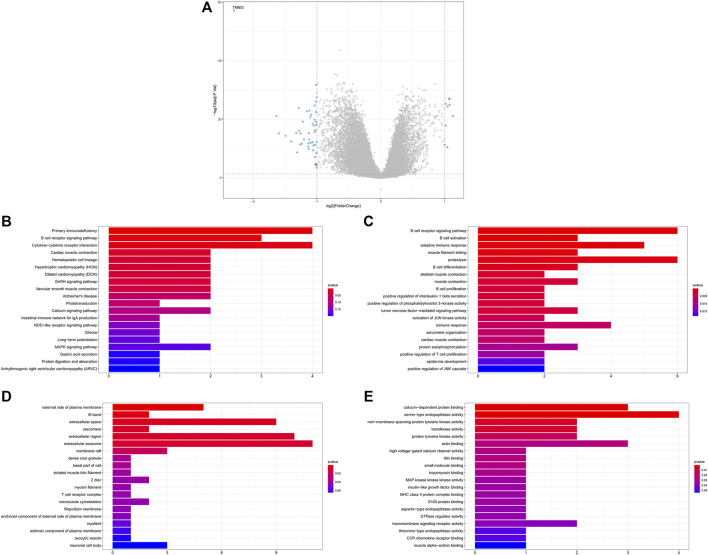
FIGURE 5.
Functional annotation of differentially expressed genes (DEGs) between the low- and high-risk groups. (A) Volcano plot for DEGs between low- and high-risk groups; (B) top 20 KEGG pathways; (C–E) top 20 GO terms, including biological processes (C), cellular components (D), and molecular functions (E).

