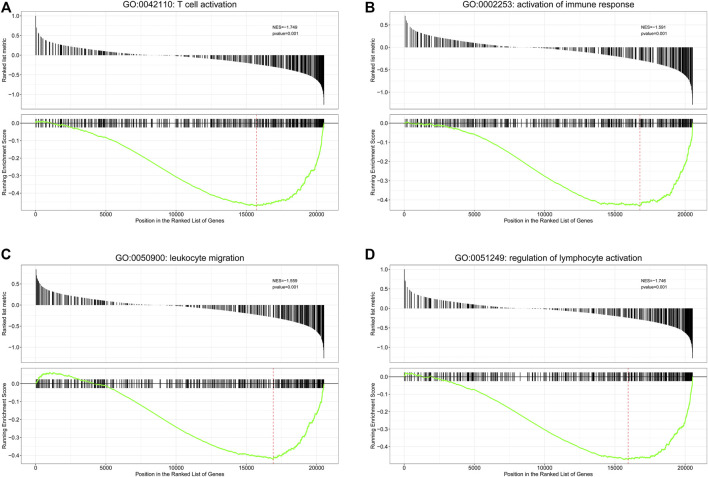
FIGURE 6.
Gene set enrichment analysis (GSEA) analysis for biological processes enriched in low- and high-risk groups. GSEA plots with normalized enrichment score (NES) and p-value are shown here for immune-related genes sets, where significant enrichment was observed. Negative NES refers to enrichment in the low-risk group. (A) T cell activation; (B) activation of immune response; (C) leukocyte migration; (D) regulation of lymphocyte activation.

