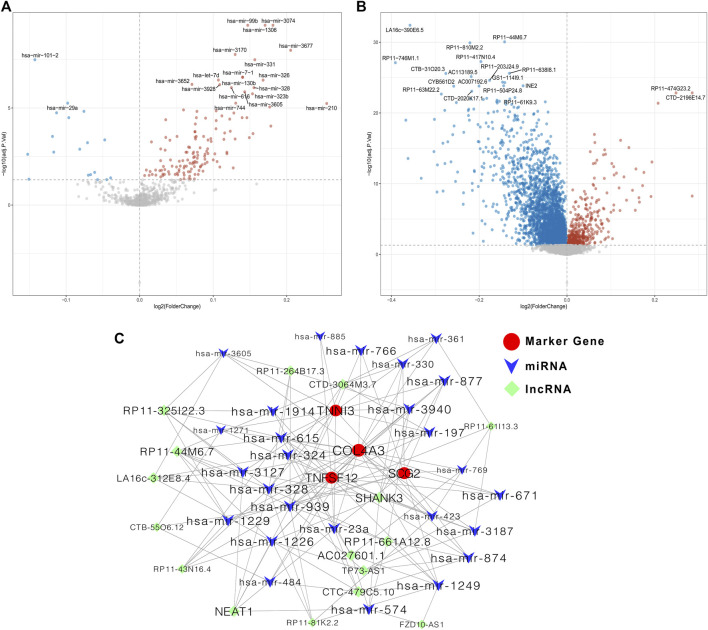
FIGURE 8.
Construction of the ceRNA regulatory network based on the four prognostic biomarkers. (A) Volcano plot for differentially expressed miRNAs between low- and high-risk groups; (B) volcano plot for differentially expressed lncRNAs between low- and high-risk groups; (C) ceRNA regulatory network among miRNAs, lncRNAs, and mRNA of the four prognostic ARGs.

