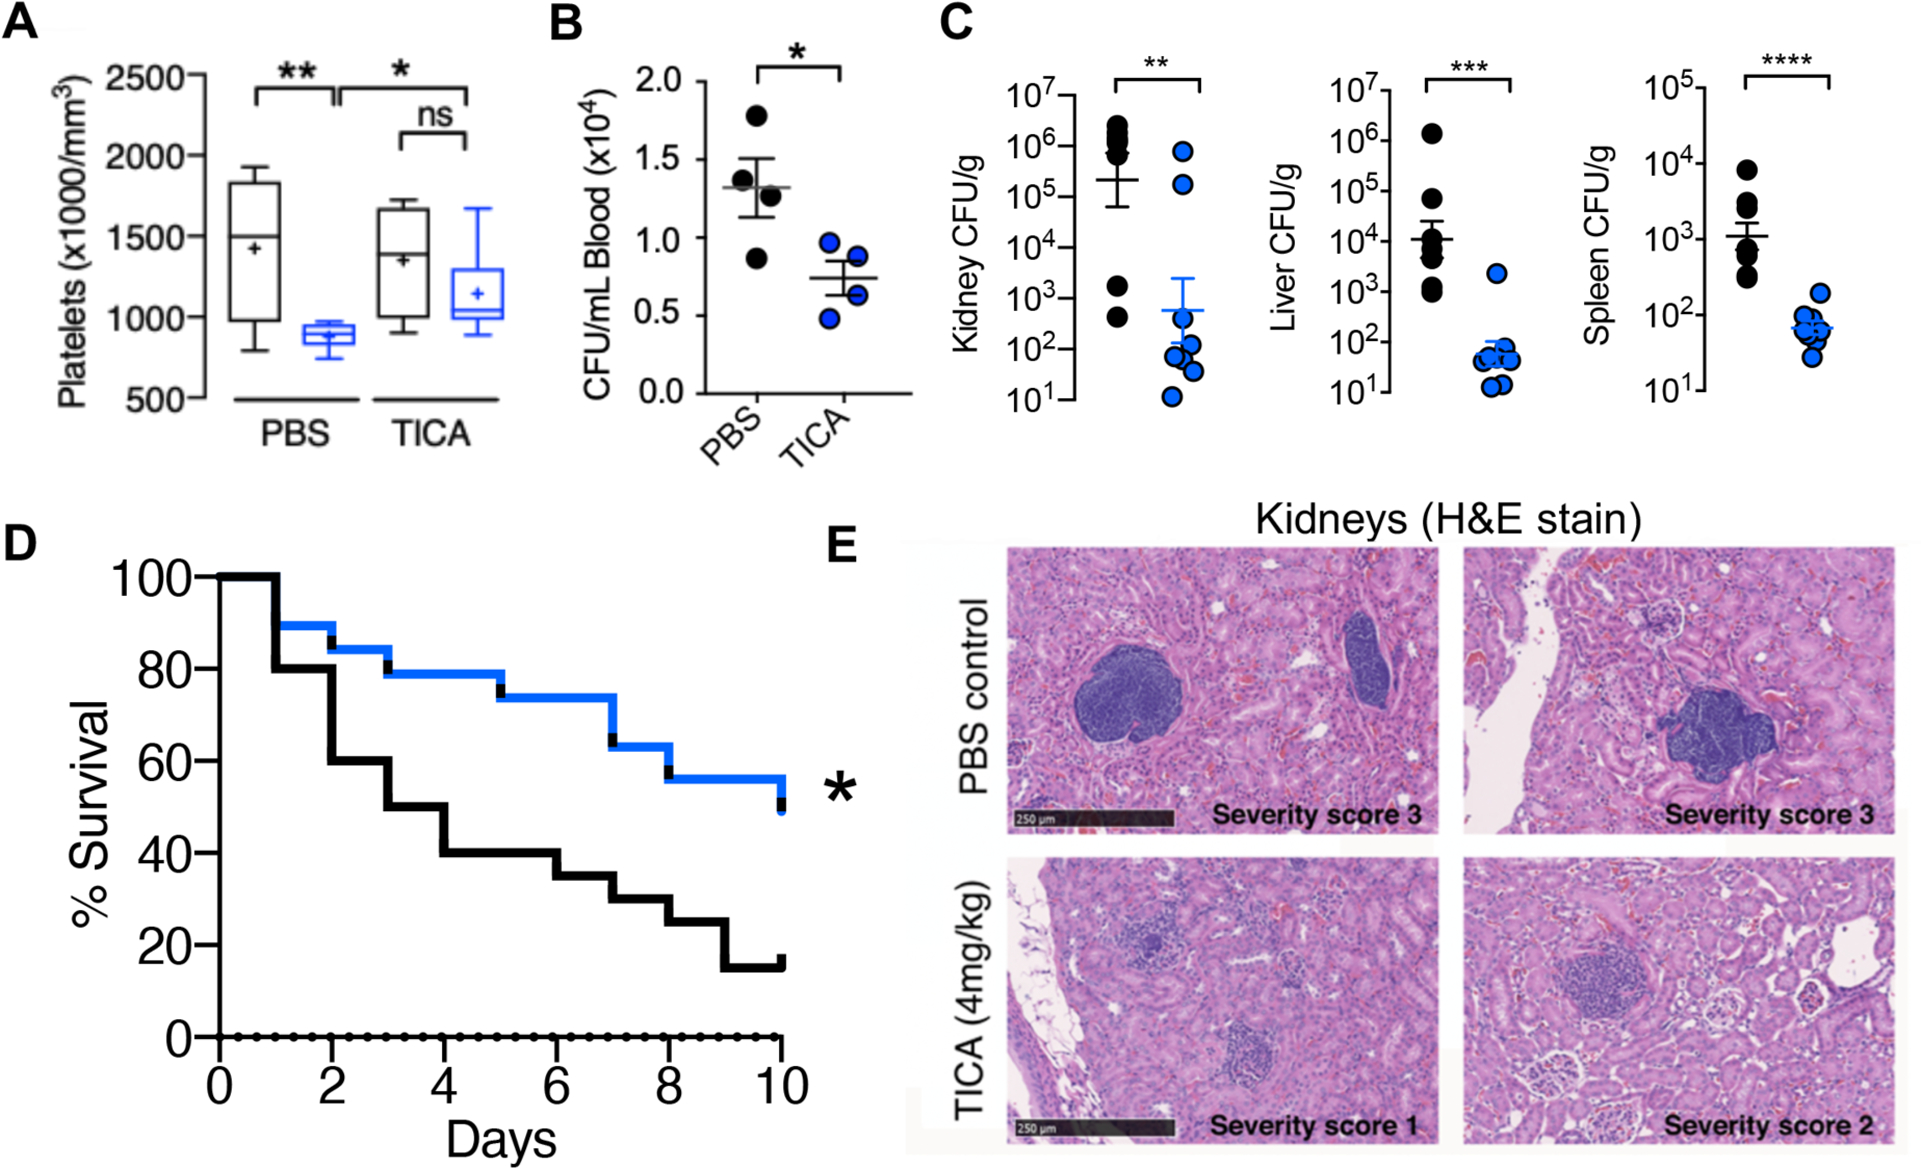
Fig. 3. FDA-approved P2Y12 inhibitor ticagrelor protects against SA bacteremia.

(A and B) Outbred CD-1 mice treated with 4 mg/ml ticagrelor (TICA; n = 9) or PBS (n = 9) control every 12 h for 3 days, then challenged intravenously with 1 × 10⁸ colony forming units (CFUs) of SA; blood platelets and bacterial CFU burden enumerated 4 h post-infection. (C) Enumeration of bacterial CFU burden at 72 h in organs of mice pretreated with vehicle (PBS) or 4 mg/kg ticagrelor 12 h prior to intravenous SA and q 12 h thereafter; (n= 8). (D) Mortality curves of outbred CD-1 mice pretreated with vehicle (PBS) or 4 mg/kg ticagrelor beginning 24 h prior to intravenous SA infection then q 12 h over a 10-day observation period (n = 20). Independent experiments were repeated twice and data pooled. (E) Hematoxylin and eosin stain (H&E) of representative histological kidney sections from mice pre-treated with PBS vehicle or 4 mg/kg ticagrelor 12 h prior to SA infection and q 12 h thereafter for 72 h; (n = 8). Yellow stars denote formation of dense bacterial colonies and black arrows represent immune infiltrate. All histological sections are representative photos of at least 6 samples per two independent experiments. Where applicable, results are represented as mean ± SEM and statistical significance was determined by unpaired two-tailed Student’s t-test (B,C), and two-way ANOVA with Bonferroni’s multiple comparisons posttest (A). For survival curves, statistical significance determined by Log-rank Mantel-Cox test (D); *P < 0.05. For floating bar graphs, + denotes the mean, whiskers represent min. to max, and floating box represents 25th to 75th percentile. *P < 0.05, **P < 0.005, ***P < 0.0005.
