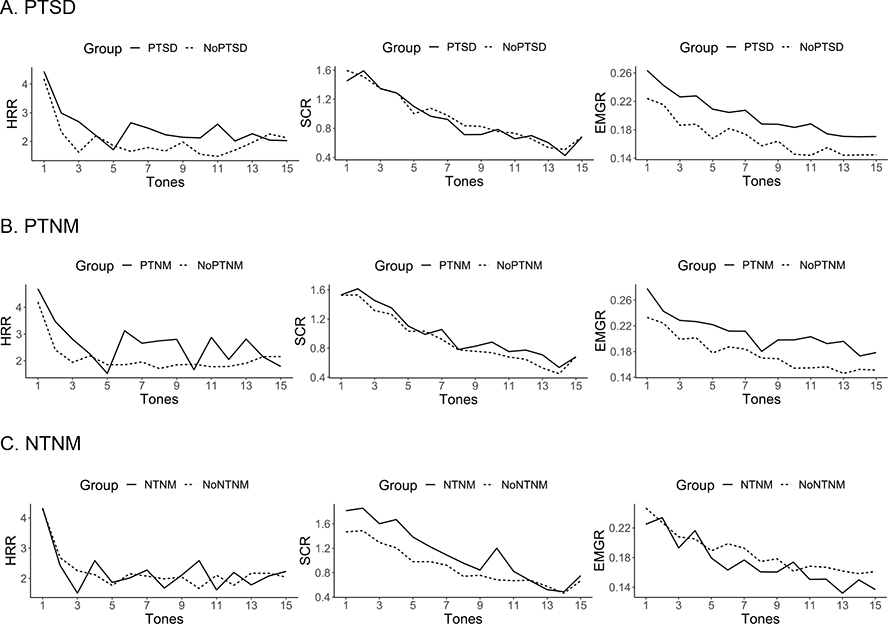
Fig. 1.
Plots of the group mean responses to the 15 loud tone presentations. The groups shown in this figure represent alternate ways of dichotomizing the total sample and the PTSD and nightmare groups are not mutually exclusive. Participants who reported both frequent posttraumatic and nontraumatic nightmares were assigned to the more severe PTNM group. A = Responses for ‘PTSD’ (solid line) vs. ‘No PTSD’ (dotted line) groups, B = responses for the ‘PTNM’ (solid line) vs. ‘No PTNM’ (dotted line) groups (PTNM = at least one posttraumatic nightmare/week), C = responses for the ‘NTNM’ (solid line) vs. ‘No NTNM’ (dotted line) groups (NTNM = at least one nontraumatic nightmare/week). HRR = heart rate mean response, SCR = skin conductance mean response, EMGR = electromyogram mean response (left orbicularis oculi).

