
FIGURE 3.
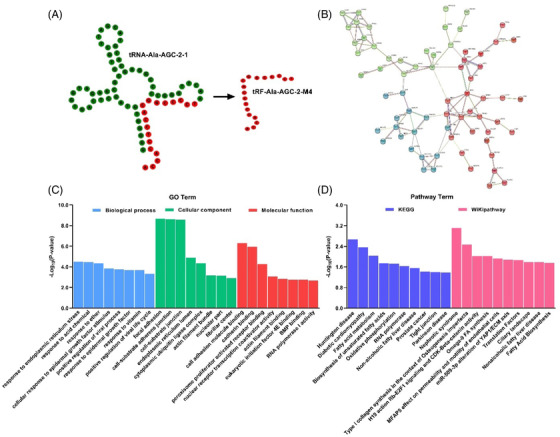
The biological functions of tRF‐Ala‐AGC‐2‐M4. (A) Secondary structure prediction of tRF‐Ala‐AGC‐2‐M4. (B) Network interaction mapping of tRF‐Ala‐AGC‐2‐M4 with genes where the minimum required interaction score was set to .5 and k‐means clustering was adopted. (C, D) GO terms and signal pathway analysis of tRF‐Ala‐AGC‐2‐M4. The conditions of cluster analysis were as follows: tsRNAs were highly expressed and coexpressed only in tRF‐gene interactions (TGIs), while the number of genes cotargeted by tsRNAs was at least 1. Bioinformatics analysis and structure prediction of tRF‐Ala‐AGC‐2‐M4 was performed via the tRNAdb database (http://trna.bioinf.uni‐leipzig.de/), network map prediction via STRING (https://cn.string‐db.org/) and GO and pathway analysis via tRFTar (http://www.rnanut.net/tRFTar/)