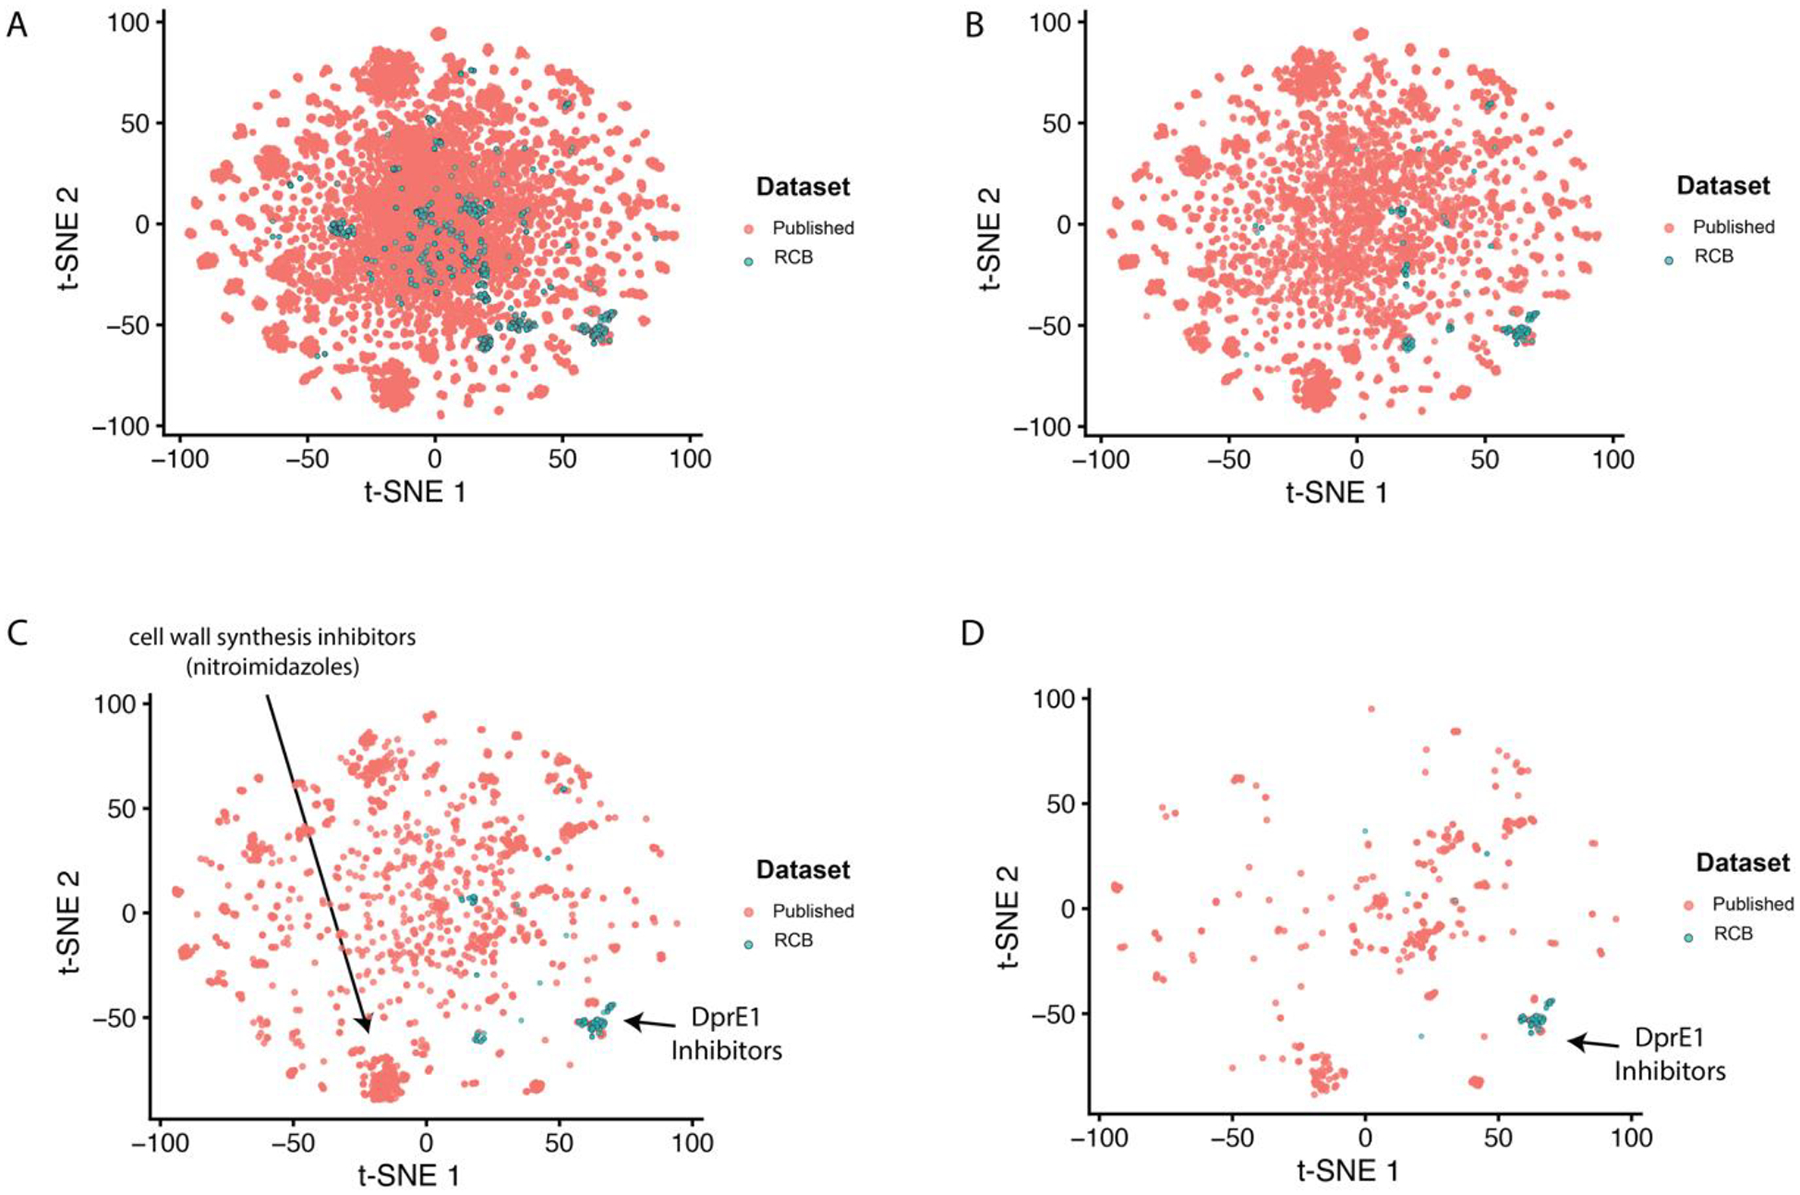
Figure 4.

t-SNE plot data at different thresholds. (A) Full comparison of the RCB Mtb data and previously published Mtb dataset66. For clarity, an activity filter was also added for different thresholds (B,10μM; C,1μM; D,100nM) to highlight the difference in the active compounds visualized by the t-SNE plot.
