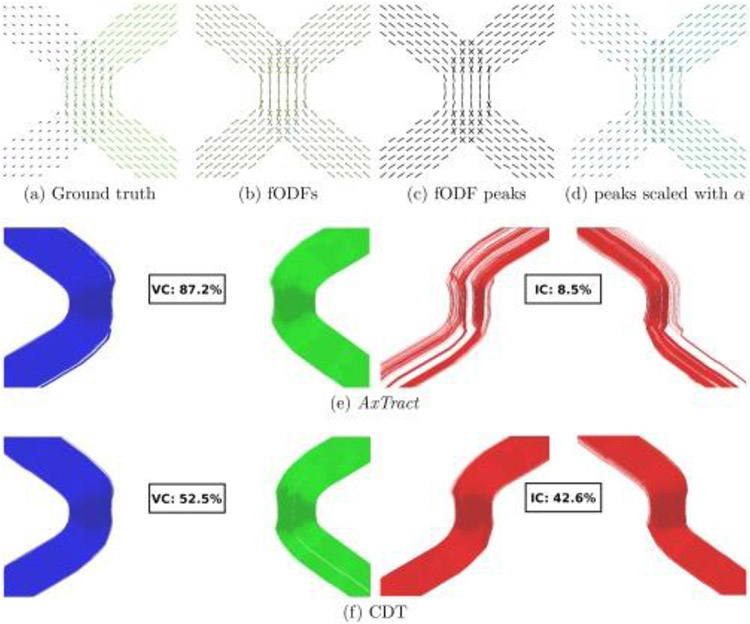
Fig. 11. Illustration of the AxTract framework.
(a) Ground truth directions used to generate the data with their lengths scaled by the axon diameter index α. (b) Estimated fiber ODFs (fODFs), (c) fiber ODF peaks and (d) fiber ODF peaks with their lengths scaled by α, (e) show valid connections (VC) and invalid connections (IC) for AxTract. (f) VC and IC for conventional deterministic tractography (CDT) are provided for comparison. Figure adapted from (Girard et al., 2017).

