
Figure 11.
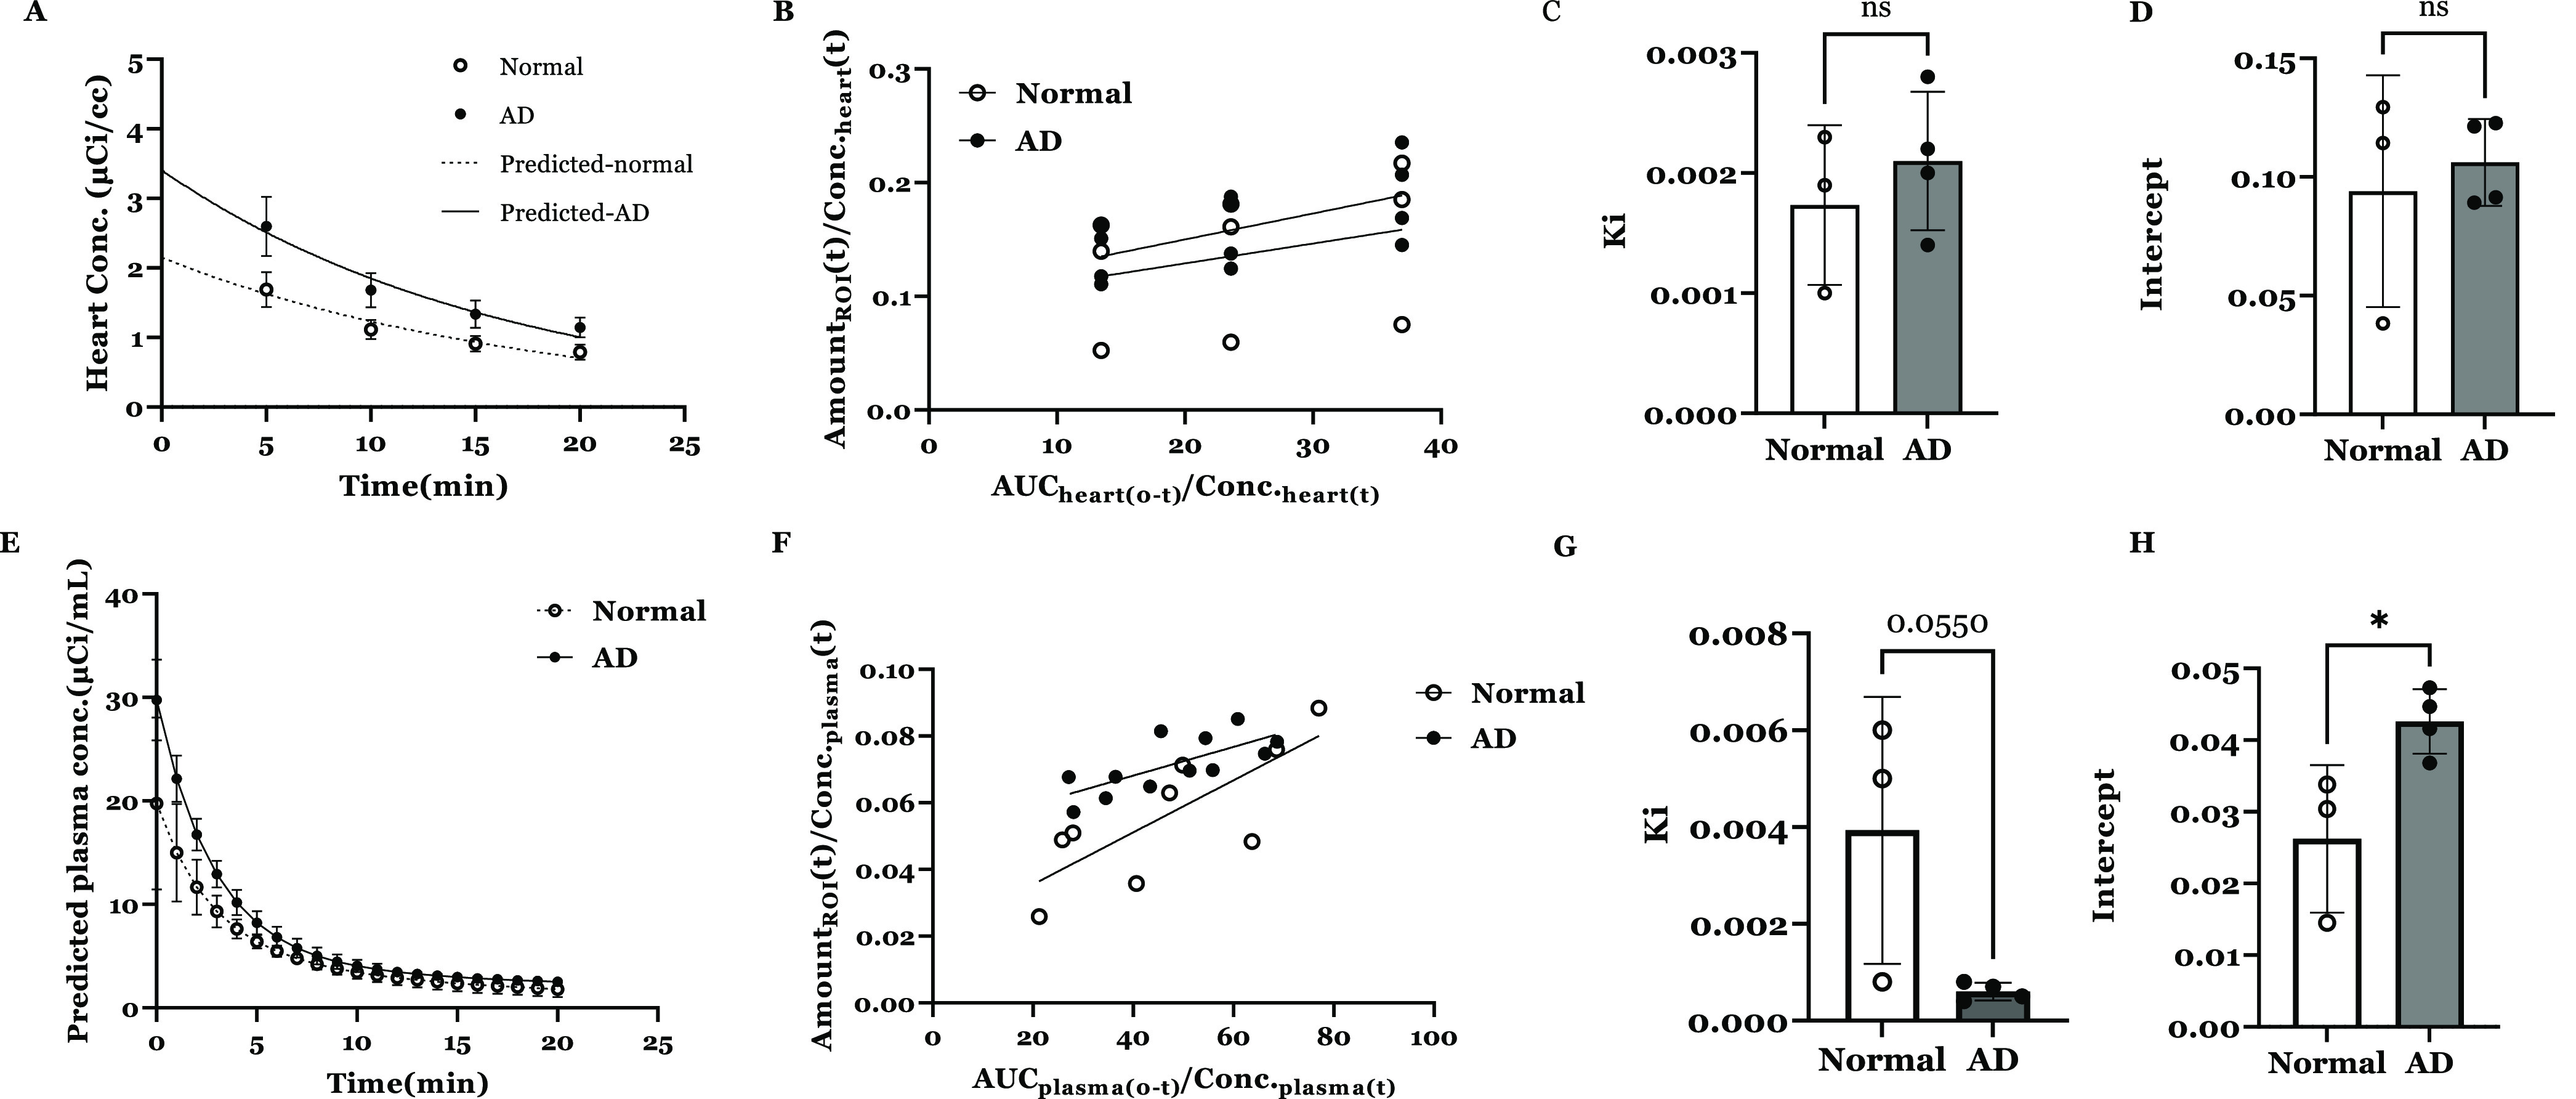
(A) Heart concentration vs time profile of [68Ga]Ga-NOTA-insulin in normal vs AD mice. Observed values (mean ± SD, normal: n = 4, AD: n = 3) overlaid with the predicted curves are shown. (B) Gjedde–Patlak plot describing the Ga-insulin influx clearance and ligand binding with the receptor at the BBB interface in the normal vs AD mouse using heart concentration data. Observed values (mean ± SD) are shown. Bar graph of the brain influx clearance (C) and instantaneous interaction with the BBB (D) of [68Ga]Ga-NOTA-insulin were estimated by the slope and intercept obtained from Gjedde–Patlak graphical analysis. Observed values (mean ± SD) and unpaired Student’s t-test are shown. (E) Predicted plasma concentration vs time profile of [68Ga]Ga-NOTA-insulin in normal vs AD mice. Observed values (mean ± SD) overlaid with the predicted curves are shown. (F) Gjedde–Patlak plot describing the [68Ga]Ga-NOTA-insulin influx clearance and instantaneous interaction with the BBB in the normal vs AD mouse using predicted plasma concentration data. Observed values (mean ± SD) are shown. Bar graph of the brain influx clearance (G) and the receptor binding at the BBB interface (H) of [68Ga]Ga-NOTA-insulin were estimated by the slope and intercept obtained from Gjedde–Patlak graphical analysis. Observed values (mean ± SD) and unpaired Student’s t-test (*p < 0.05) are shown.