
17.
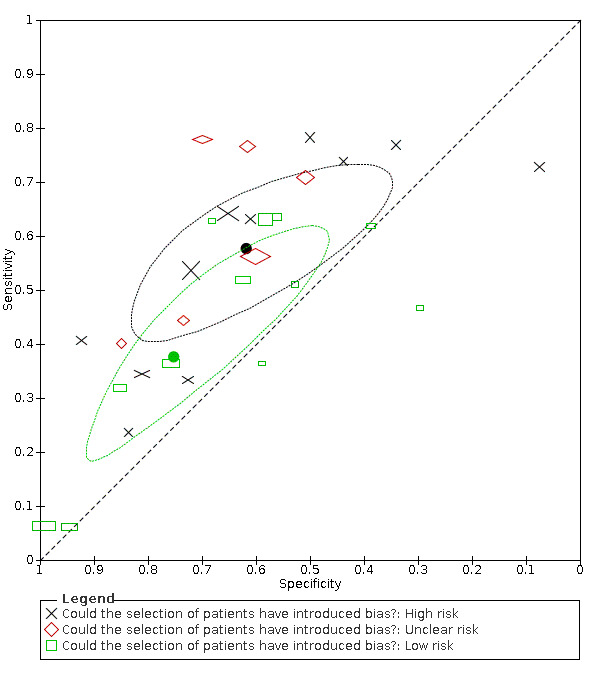
Summary ROC plot of fever by risk of bias concerning participant selection. Summary points and their 95% confidence regions are shown for high and low risk of bias only. The study points (symbols) were scaled according to the sample size
Official websites use .gov
A
.gov website belongs to an official
government organization in the United States.
Secure .gov websites use HTTPS
A lock (
) or https:// means you've safely
connected to the .gov website. Share sensitive
information only on official, secure websites.
Summary ROC plot of fever by risk of bias concerning participant selection. Summary points and their 95% confidence regions are shown for high and low risk of bias only. The study points (symbols) were scaled according to the sample size