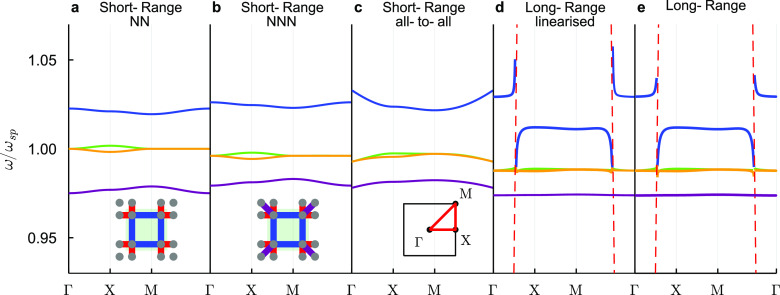
Figure 6.
Calculating the SSH2D dispersion relation: SSH2D bands for silver nanospheres with radius a = 8 nm, unit cell width d = 10a = 80 nm, intracell length t = βd/2 = 1.4 × 5a = 56 nm and background permittivity ϵB = 2.25. Solid lines represent the bands, while red dashed lines in panels (d) and (e) represent light lines. As insets in panels (a) and (b), we show the SSH2D unit cells (green squares), where gray dots are the nanospheres, blue links represent first intracell neighbors, red links represent first intercell neighbors, and purple links represent next nearest neighbors. As an inset in panel (c), we plot the reciprocal unit cell and the band path ΓXMΓ (red solid line).

