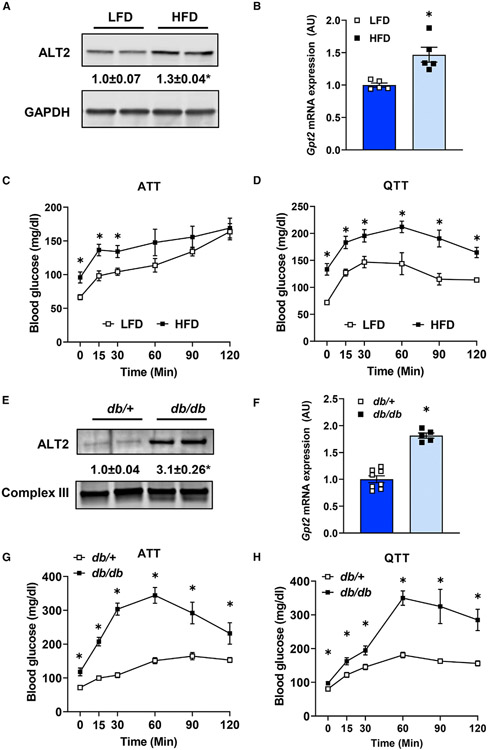
Figure 2. Diet-induced obese and db/db mice exhibit increased hepatic ALT abundance and exacerbated hyperglycemia from gluconeogenic amino acids.
(A and B) (A) Representative western blot images for ALT2 and GAPDH proteins and (B) expression of Gpt2 mRNA in livers of mice fed either a control low-fat diet (LFD) (n = 5) or a 60% high-fat diet (HFD) (n = 5).
(C and D) Blood glucose concentrations after an i.p. injection of L-alanine (C) or L-glutamine (D) in diet-induced obese (HFD; n = 5) and lean (LFD; n = 5) mice.
(E) Representative western blot image for ALT2 and mitochondrial complex III from either db/+ or db/db mouse liver homogenates.
(F) Expression of Gpt2 in liver RNA from db/+ (n = 8) and db/db (n = 5, 7) mice (bottom panel).
(G and H) Blood glucose concentrations after an i.p. injection of L-alanine (G) or L-glutamine (H) in db/+ (n = 7, 8) and db/db mice (n = 6, 7). For (A) and (E) densitometric quantification of ALT2/loading control band intensity is provided numerically between the blots. Data are presented as mean ± SEM. *p ≤ 0.05 for LFD versus HFD or db/+ versus db/db.

