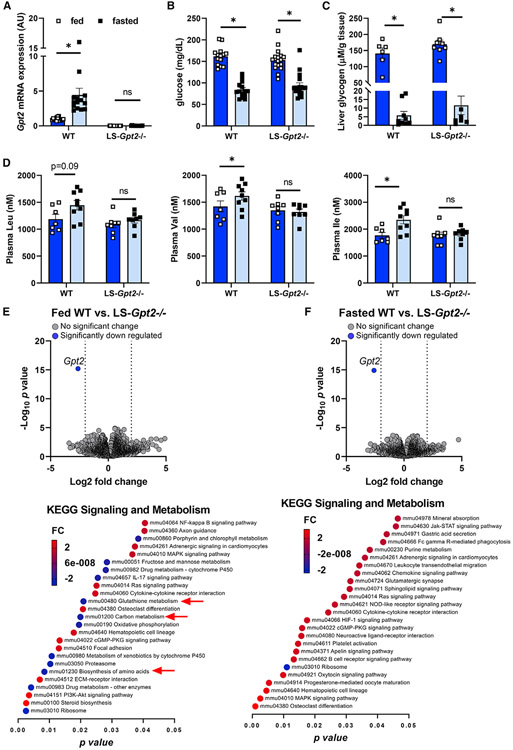
Figure 5. Loss of liver ALT2 does not affect blood glucose levels in lean mice.
(A) Gpt2 mRNA expression in liver from fed and fasted WT and LS-Gpt2−/− mice.
(B) Blood glucose concentrations of fed and fasted WT and LS-Gpt2−/− mice (n = 14–17 mice per group).
(C and D) (C) Liver glycogen concentrations and (D) plasma branched chain amino acids levels of fed and fasted WT and LS-Gpt2−/− mice.
(E and F) Bulk RNA sequencing analysis shows only Gpt2 is significantly altered by LS-Gpt2−/− knockout. Volcano plots of merged differential expression data from hepatic RNA of (E) fed WT versus LS-Gpt2−/− or (F) fasted WT versus LS-Gpt2−/− mice. Data were graphed as log2 fold change verses –log10 unadjusted p value. Gene expression changes were considered meaningful if they were >log2 fold change and had an adjusted p value of <0.05 versus WT mice. Graphical representation of pathway analysis showing the top 25 significant signal direction changes of KEGG Signaling and Metabolism pathways. The color of the pathway label indicates the degree and direction of the change and the p value is the x axis. Data are presented as mean ± SEM. *Significant differences (p < 0.05) between indicated groups.

