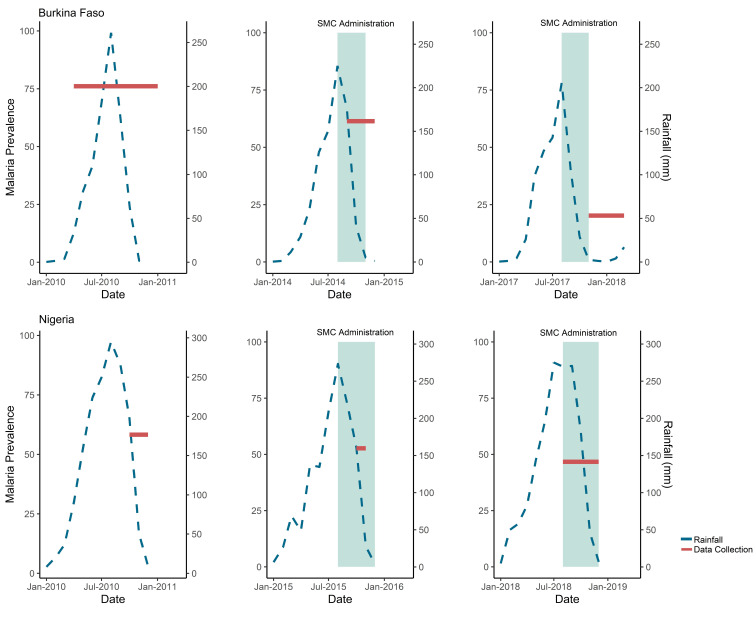
Figure 2.
Timing of rainfall, SMC administration and MIS data collection by month and year, Burkina Faso and Nigeria. Data shown are for prevalence of malaria measured by DHS/MIS and average monthly millimetres (mm) of rainfall by month and year of survey in Burkina Faso and Nigeria. Prevalence of malaria diagnosed by RDT by survey is shown by the red line spanning the months of data collection. Average monthly mm of rainfall is shown by the blue line. The timing of SMC administration is shown in comparison to the rainfall and survey data collection in teal. In Burkina Faso in 2014, there were seven health districts with SMC administration surveyed and in 2017 there were 56. In Nigeria in 2015, there were 6 LGAs with SMC administration surveyed and in 2018 there were 46. DHS, Demographic Health Survey; LGAs, local government areas; MIS, Malaria Indicator Surveys; RDT, rapid diagnostic test; SMC, seasonal malaria chemoprevention.

