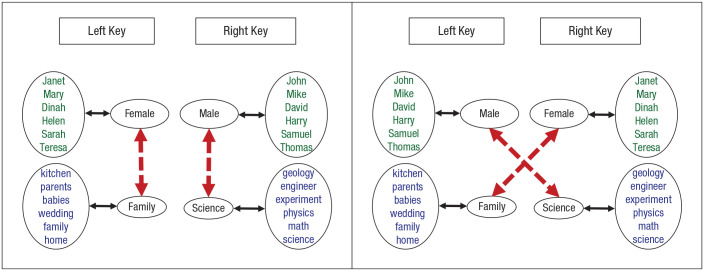
Fig. 2.
Representation of associations involved in responding to an Implicit Association Test gender–science stereotype measure. The left panel shows four categories in a stereotype-consistent structure; associations link all categories and exemplars for the instructions that request a response to each key. The red arrows represent the stereotype-consistent associations. In the right panel, these associations cross between the keys, comprising a source of interference in providing the instructed responses.

