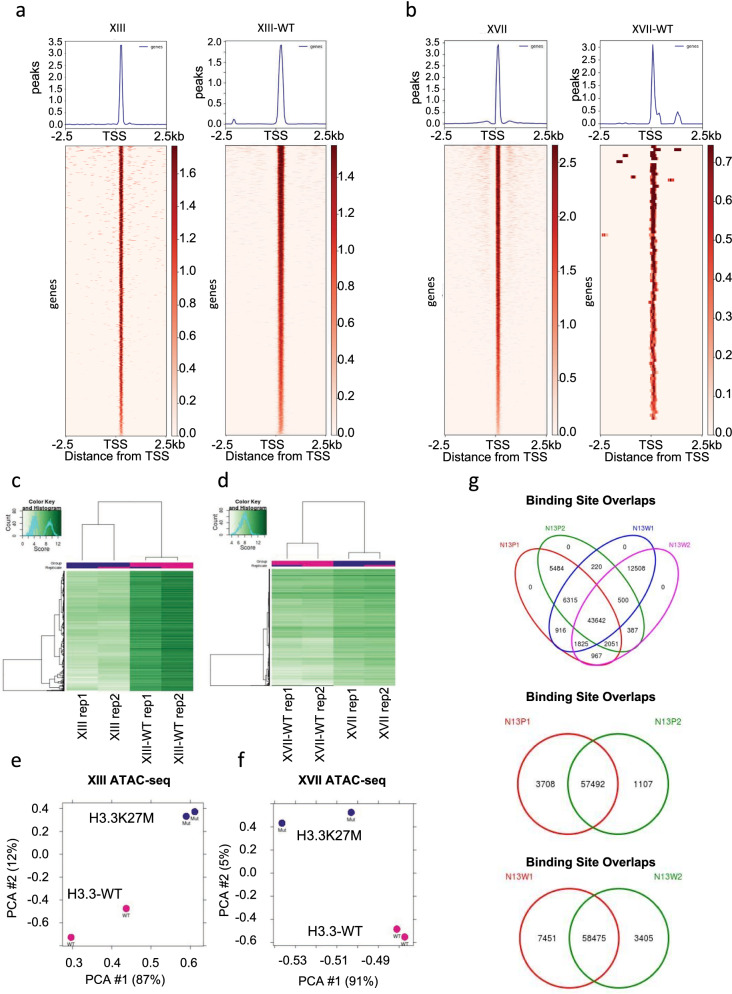
Fig. 1.
Genome-wide profile of accessible chromatin regions in H3.3K27M and H3.3-WT DIPG tumor samples. a Read density heatmaps and average profiles of ATAC-seq peaks for XIII and XIII-WT, b XVII and XVII-WT. c Hierarchical clustering analysis of accessible chromatin regions via ATAC-seq comparing XIII and XIII-WT, d XVII and XVII-WT. e Principal component analysis (PCA) of significantly differential peaks between XIII and XIII-WT, f XVII and XVII-WT. g Overlap of ATAC-seq peaks in XIII and XIII-WT duplicates (top), XIII duplicates alone (middle), and XIII-WT duplicates alone (bottom)

