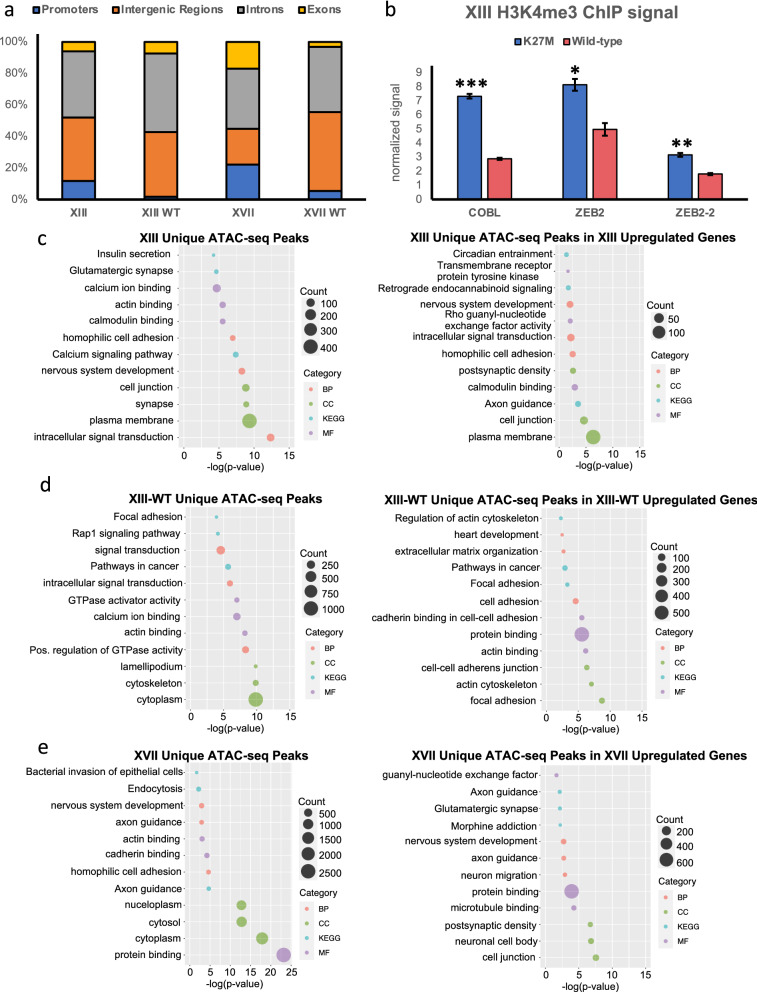
Fig. 2.
H3.3K27M DIPG cells are enriched for open chromatin peaks in upregulated genes related to the nervous system compared to their isogenic gene-edited wild-type counterparts. a Bar plot showing proportion of peaks in various genomic regions. Promoters were defined as 2 kb upstream of the TSS and 1 kb downstream. 75% or more of the peaks for each line were found in intergenic regions or introns. b H3K4me3 levels at genes associated with changes in ATAC-seq peaks between Line XIII PAR (K27M, blue) and WT (wild-type, red) cell lines, validated by ChIP–qPCR. n = 2 biological replicates, *p value < 0.05, **p value < 0.01, ***p value < 0.001 and error bars were calculated based on standard deviation. c Gene ontology analysis of differential open chromatin (left side) and specifically open chromatin regions linked to increased gene expression (right side) in XIII, d XIII-WT, and e XVII. BP biological processes, CC cellular components, KEGG KEGG Pathways, and MF molecular function. For enriched GO terms p values were obtained from the Benjamini–Hochberg method

