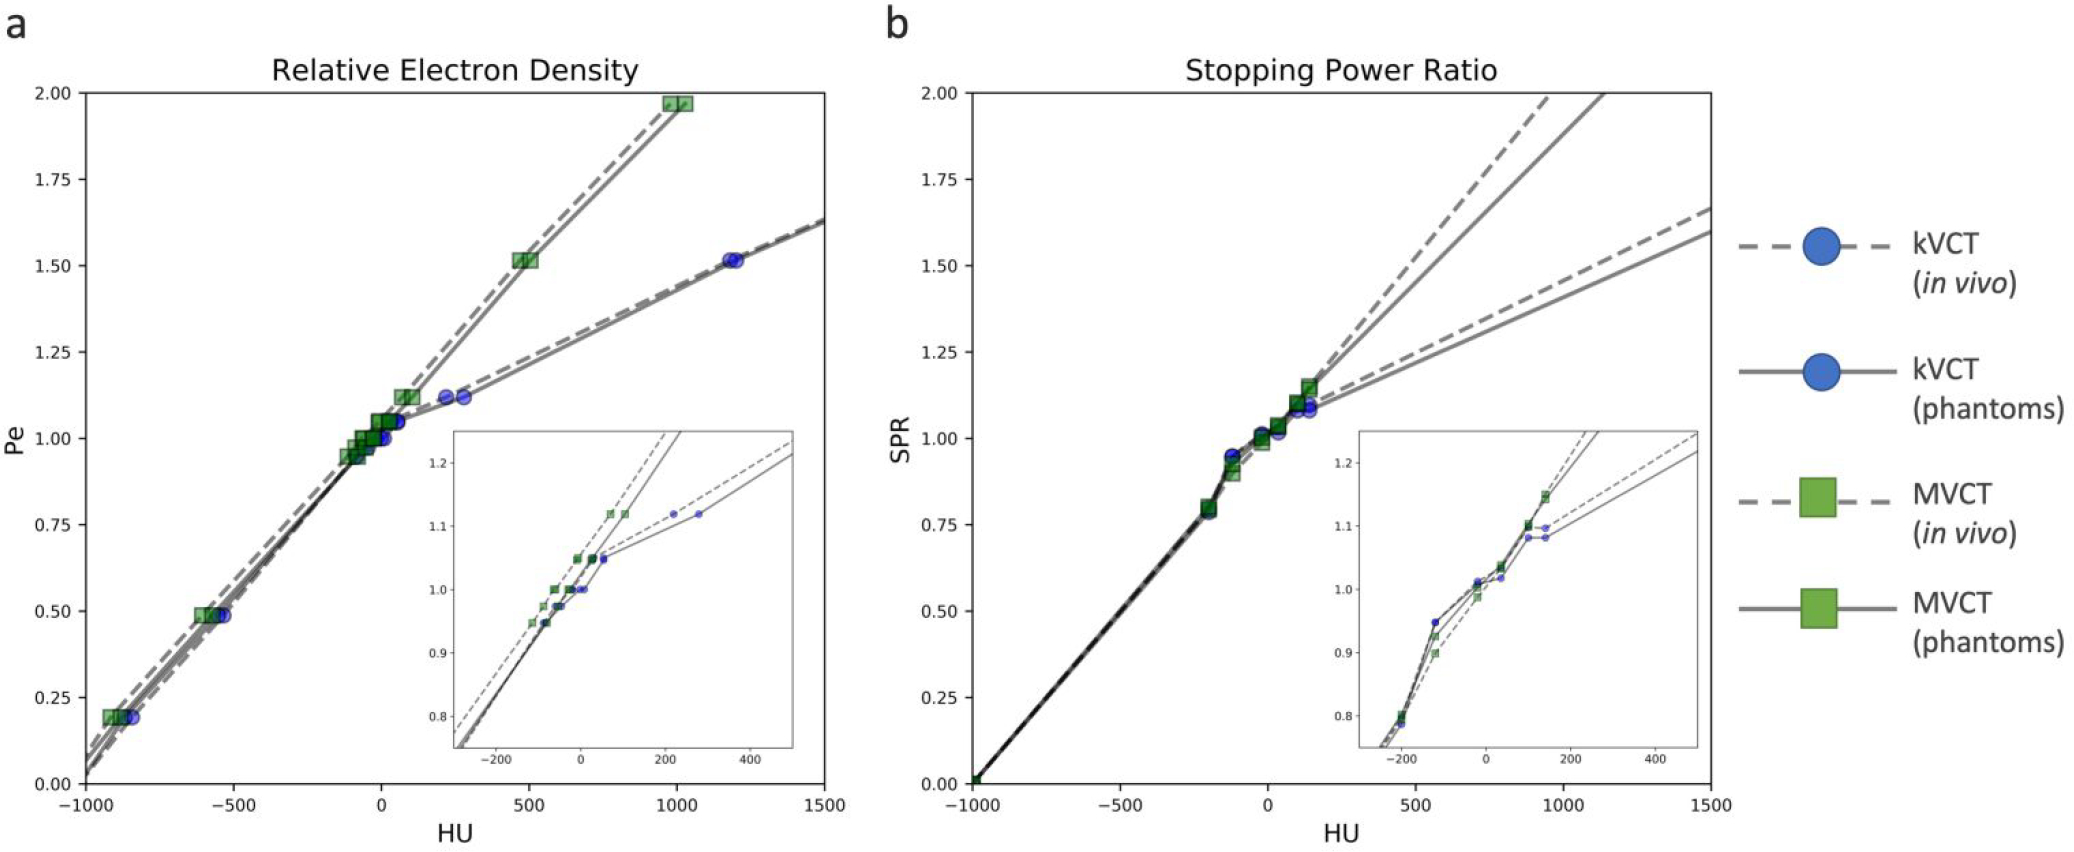
Figure 2.

HU plotted against ρe (a) and SPR (b) derived from kVCT and MVCT scans. The HU-vs-ρe curves were derived using vendor-provided relative electron density values with corresponding HU values for each tissue surrogate material. Both kVCT and MVCT curves were interpolated from nine points, one for each tissue surrogate plug in the CIRS phantom. Note that in both kVCT curves, one point extends beyond 1500 HU and is not shown for figure clarity. The HU-vs-SPR curves were derived using a linear regression fit to theoretical HU values calculated for 64 human tissues provided in the literature. Both kVCT and MVCT curves contain six points, one for each node at HU values of −200, −120, −20, +35, +100, and +140. For both HU-to-ρe and HU-to-SPR curves, note the typical bilinear distribution for kVCT, contrasted by the linear distribution for MVCT. All calibration curves were generated twice: one for the phantom data and one for the in vivo data, which was acquired retrospectively two years prior to the phantom data.
