
Figure 5.
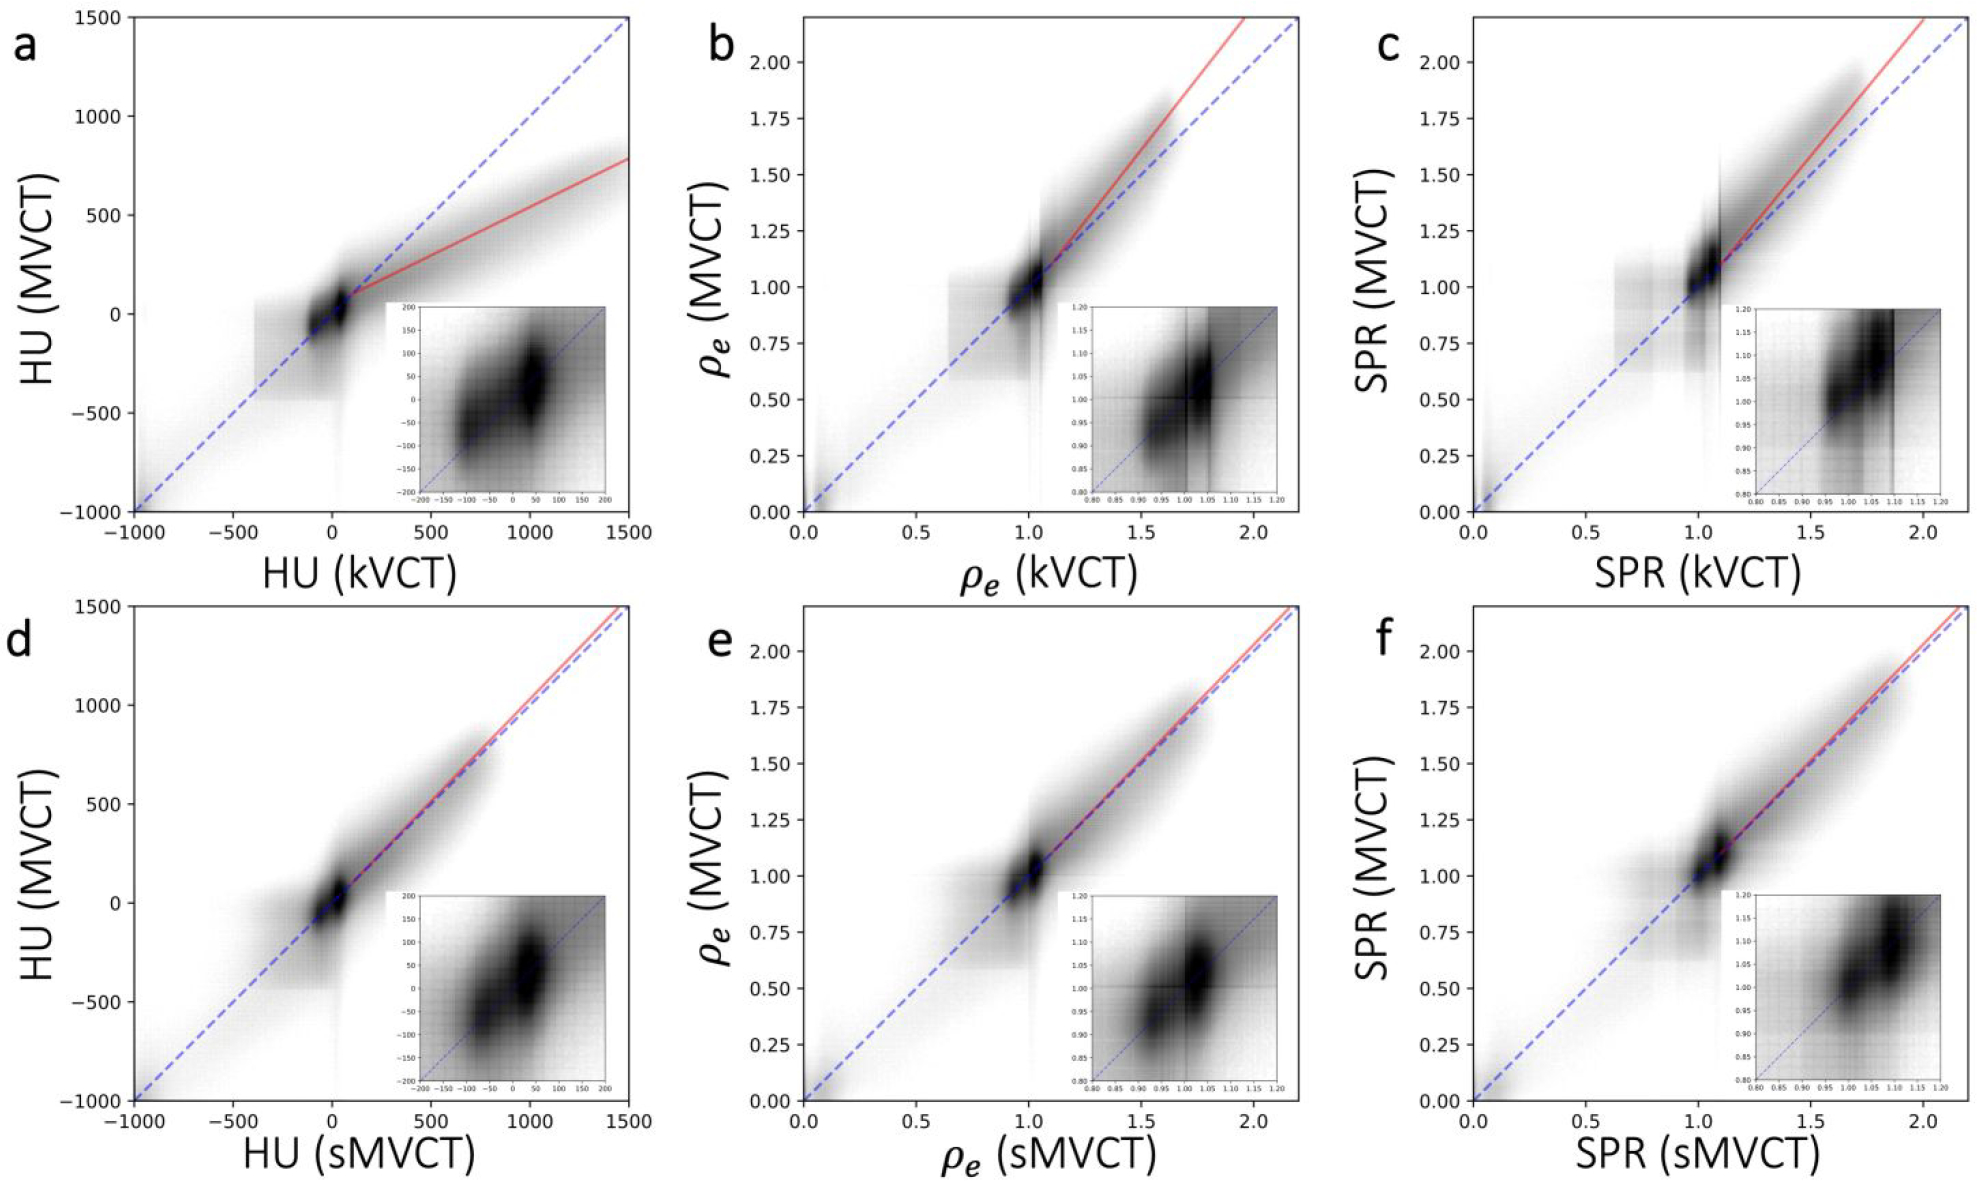
A heatmap plot of HU (left column), ρe (middle column), and SPR (right column) values at each voxel in a given CT scan plotted against HU values at the same voxel in a different CT scan for kVCT vs MVCT (top row) and b) sMVCT vs MVCT (bottom row). Grey scale values were plotted on a log scale with numbers of voxel. The dotted blue diagonal line in each panel represents a 45° reference line. The solid red line represents a linear fit of the bone data between the two image sets. In the lower righthand corner of each panel is an inset image of the −200 to 200 HU, 0.8 to 1.2 ρe values, and 0.8 to 1.2 SPR values expanded for greater clarity.