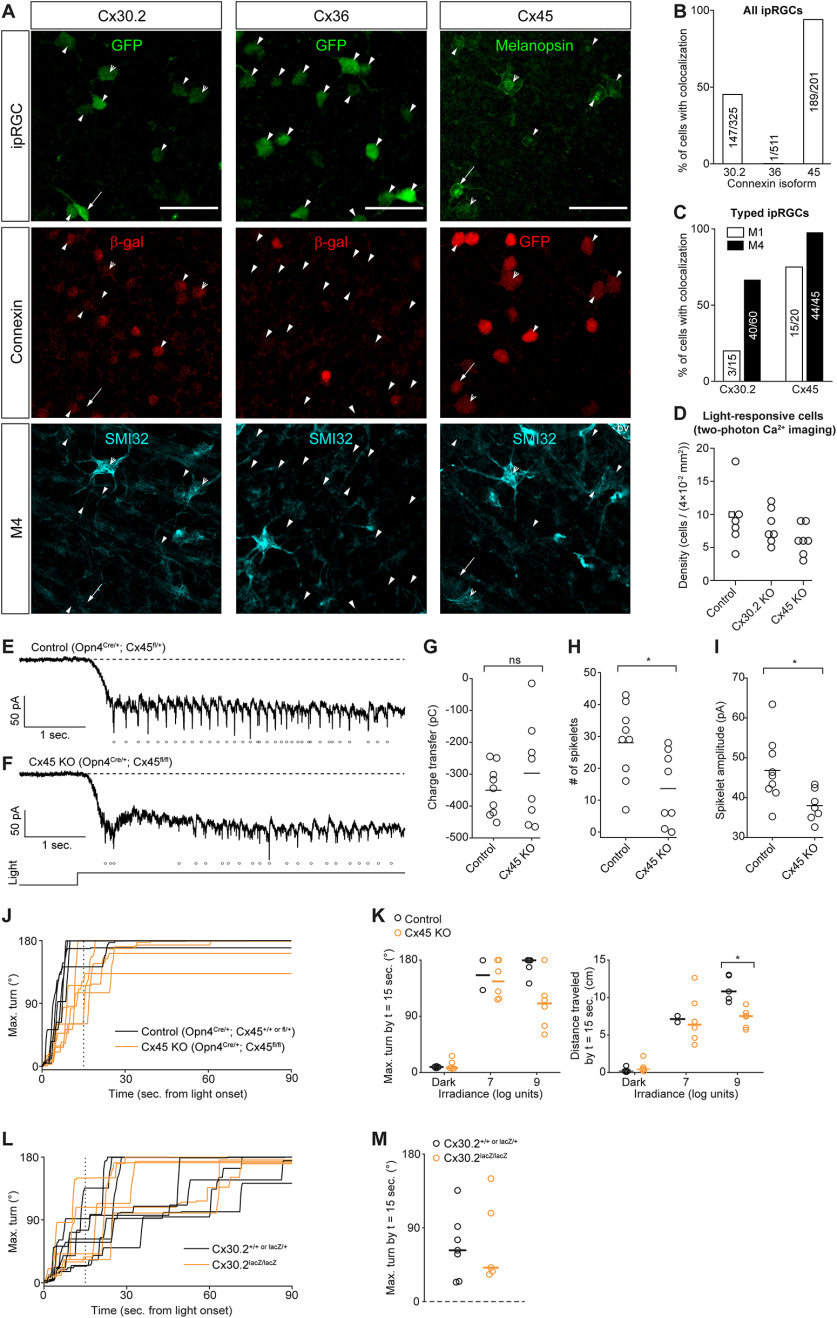
Figure 5.
Connexin expression, role in ipRGC photosensitivity, and contribution to photoaversion. A, Immunohistochemistry images indicating expression of Cx30.2 (left column), Cx36 (middle column), and Cx45 (right column) in ipRGC types. Connexin expression was visualized using transgenic mouse lines (Opn4::eGFP Cx30.2lacZ/+, Opn4::eGFP Cx36lacZ/+, and Opn4Cre/+ Cx45fl/+) that express lacZ and GFP in place of the genes encoding Cx30.2, Cx36, and Cx45, respectively. Open arrowheads indicate M4 ipRGCs (GFP+ or melanopsin+ and SMI32+). Arrows indicate M1 ipRGCs (dendritic stratification in the outermost OFF layer of the inner plexiform layer). Closed arrowheads indicate ipRGCs of unknown type. Scale bar, 50 µm. bv, Blood vessel labeled by the anti-mouse secondary antibody used to detect SMI32 (see Materials and Methods). B, Bar graph represents the proportions of ipRGCs with colocalized markers for connexin expression. The number of cells is indicated within each bar. N = 2 Opn4::eGFP Cx30.2lacZ/+ mice, 2 Opn4::eGFP Cx36lacZ/+ or lacZ/lacZ mice, and 3 Opn4Cre/+ Cx45fl/+ mice. C, Same as in B, but for ipRGCs identifiable as M1 or M4. D, The density of light-responsive cells in ex vivo retinas was not significantly affected by genetic deletion of Cx30.2 or Cx45. Each point represents one FOV from a two-photon population Ca2+ imaging experiment. Light stimuli (λmax = 420 nm) were a series of 30 s pulses from 3.7 to 7.2 log units, identical to those used by us previously (Caval-Holme et al., 2019). Control: retinas from WT mice of genetic backgrounds matched to the Cx30.2 KO and Cx45 KO. N = 6 FOV from 2 Opn4::eGFP mice and 1 Opn4Cre/+ Cx45fl/+ mouse (square symbol; one copy of the Opn4 gene is replaced with Cre, as in the Cx45 KO). Cx30.2 KO: 7 FOV from 2 mice. Cx45 KO: 7 FOV from 3 mice. One-way ANOVA (F = 1.88, 2 degrees of freedom, p = 0.18). E, Voltage-clamp recording of light-evoked current in an M4 ipRGC in the ex vivo retina of a Cx45 heterozygote (Opn4Cre/+ Cx45fl/+) mouse. Dashed line indicates holding current reference. Points represent detected spikelets (inward currents magnitude > 30 pA). Illumination (λmax = 420 nm, irradiance = 108 photons μm−2 s−1) lasted for 5 s. Light monitor below F. Cells were held at −80 mV. The internal solution contained QX314 (5 mm), a voltage-gated sodium channel antagonist. Recording solution contained 50 μm D-AP5, 20 μm DNQX, and 8 μm DHβE (for further details, see Caval-Holme et al., 2019). F, Same as in E, except that the cell was from a littermate Cx45 KO (Opn4Cre/+ Cx45fl/+) mouse recorded on the same day as the cell in E. G, Comparison of light-evoked charge transfer (pico-coulombs) in M4 ipRGCs from Cx45 Hets and Cx45 KOs. Horizontal lines indicate medians. p = 0.67 (Wilcoxon rank-sum test). Cx45 Het: n = 9 cells from 4 mice. Cx45 KO: n = 8 cells from 3 mice. H, Comparison of the number of light-evoked spikelets in M4 ipRGCs from Cx45 Hets and Cx45 KOs. Horizontal lines indicate medians. *p < 0.05 (Wilcoxon rank-sum test). Same cells as in G. I, Comparison of the amplitude of light-evoked spikelets in M4 ipRGCs from Cx45 Hets and Cx45 KOs. Horizontal lines indicate medians. *p < 0.05 (Wilcoxon rank-sum test). Same cells as in G and H, with one Cx45 KO cell excluded as it had no spikelets. J, Time series of maximum head turns of P8 Control (Opn4Cre/+ Cx45+/+ or Opn4Cre/+ Cx45fl/+; black traces) and Cx45 KO (yellow traces; Opn4Cre/+ Cx45fl/fl) mice. K, Comparison of head turns (left) and travel distance (right) in P8 genetic control (Opn4Cre/+ and Opn4Cre/+ Cx45fl/+ littermates) and Cx45 KO (Opn4Cre/+ Cx45fl/fl) mice. Control: n = 3 Opn4Cre/+ and 2 Opn4Cre/+ Cx45fl/+. Cx45 KO: n = 6. *p < 0.05 (Wilcoxon rank-sum test). Error bars indicate medians. L, Time series of maximum head turns of P7 Control (black traces; Cx30.2+/+ or lacZ/+) and Cx30.2 KO (yellow traces; Cx30.2lacZ/lacZ) mice. Light stimulus intensity was 109 photons μm−2 s−1. M, Comparison of the maximum head turn 15 s after light onset. Error bars indicate medians. Same mice as in A. N = 7 Control mice and 5 Cx30.2 KO mice.

