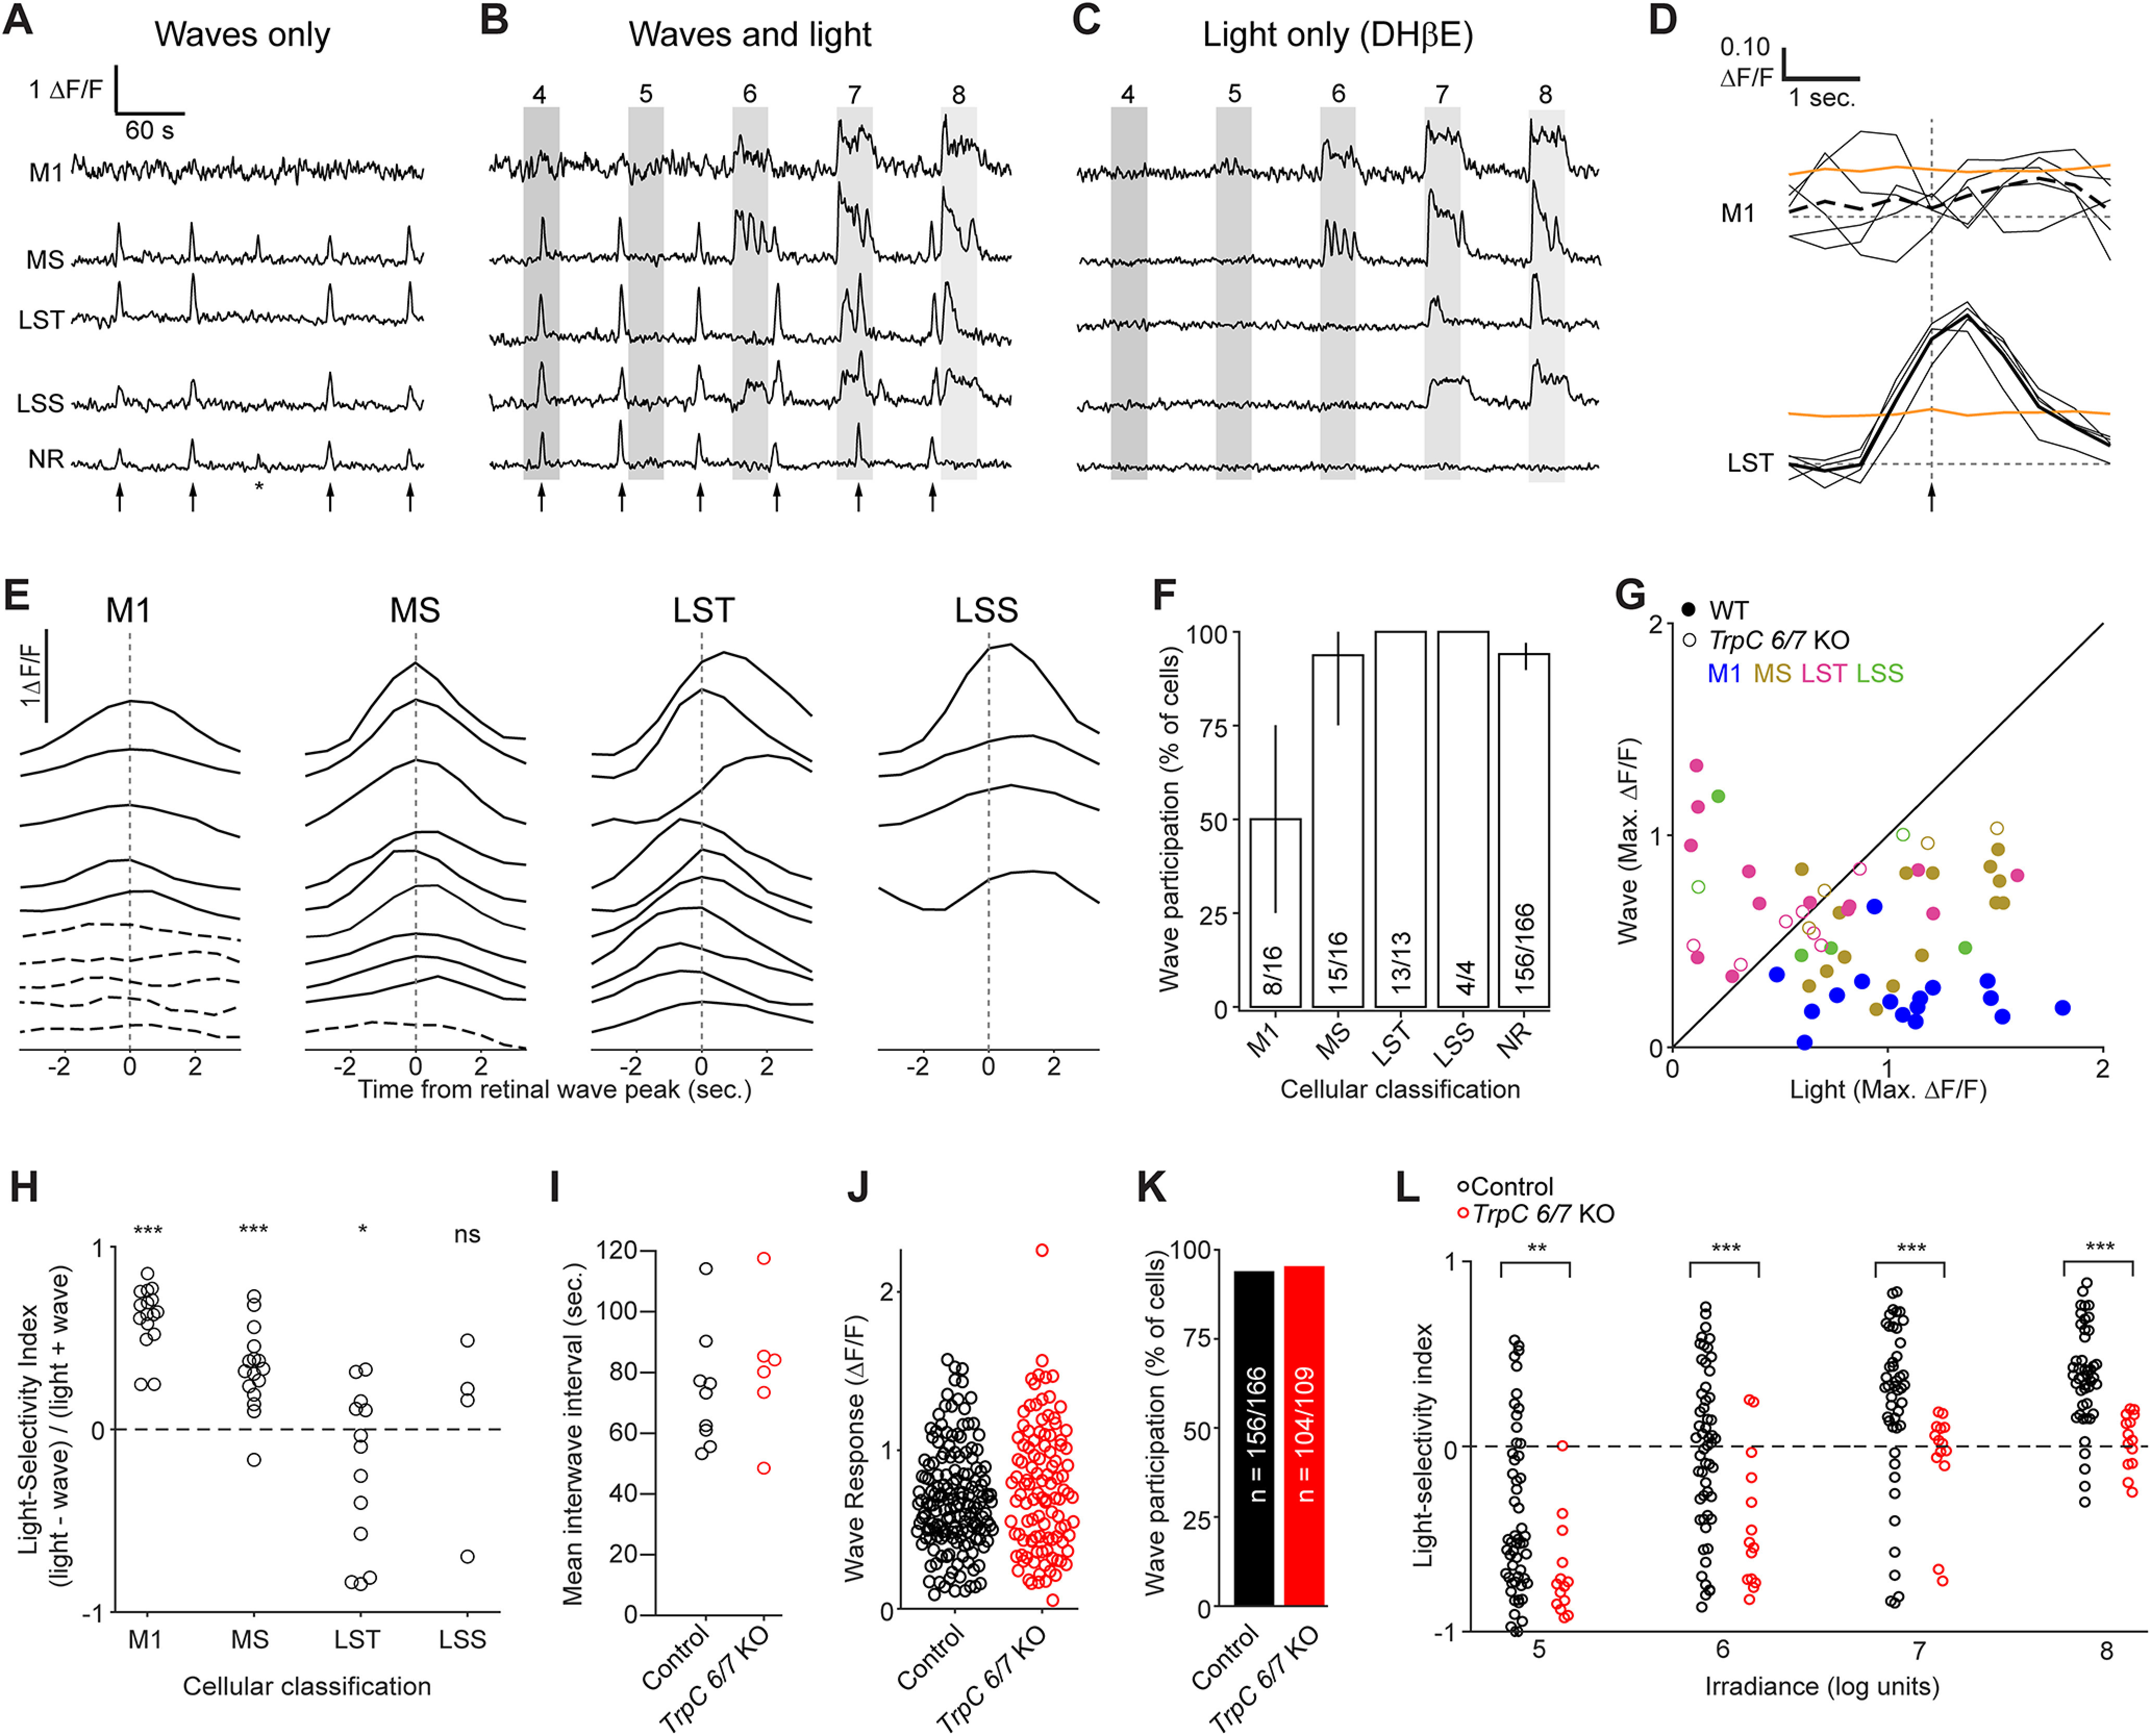
Figure 6.

M1 ipRGCs are weakly depolarized by retinal waves. A-C, Example ΔF/F traces from the same cells under a series of imaging conditions: A, Waves only. B, Waves and light stimulation. C, Light stimulation only (with waves blocked by DHβE). Arrows indicate timing of waves. Asterisk indicates a wave that involved only a portion of the FOV and was excluded from the analysis. Gray boxes represent duration of light stimuli (λmax = 470 nm; 104-108 photons μm−2 s−1). Waves-only and light-only traces were analyzed further. MS, LST, and LSS: functional cluster assignments based on each cell's light response (Fig. 2). NR: a randomly selected neuron within the ganglion cell layer that was not responsive to light. D, Sample wave-triggered averages for two of the cells in A-C. Thin black lines indicate epochs used to generate the wave-triggered average (thick black lines). Orange lines indicate 95th percentiles of distributions of averages triggered from random nonwave locations. Vertical dashed line indicates the timing of the population wave peak. Top, M1 cell (average trace shown as dashed line) did not exceed the 95th percentile at any point and was therefore defined as exempt from waves. Bottom, The LST cell clearly participates in waves. E, Representative wave-triggered average traces, vertically offset for clarity. Cells are a subset of those in Figure 2. Dashed lines indicate a lack of wave participation. M1: anatomically identified M1 ipRGCs. F, Proportions of light-responsive (M1, MS, LST, and LSS) and nonresponsive (NR) cells that participated in waves. N = 9 imaging FOV from 4 mice (1:1 C129:C57BL6/J or Opn4::eGFP). Cell counts indicated within the bar chart. Error bars indicate bootstrapped 95% CIs. G, Maximum ΔF/F responses of individual ipRGCs to waves plotted against maximum responses to light (107 photons μm−2 s−1). Each point represents one cell and is color-coded according to functional cluster assignment, based on the cell's light response (Fig. 2). N values for cells from Control mice (closed circles) are given in F. For TrpC 6/7 KO (open circles), n = 1 M1, 4 MS, 8 LST, 2 LSS cells from 5 imaging FOV from 2 mice. H, Light selectivity index (calculated as 1 – (W/L), L being the maximum ΔF/F response of a cell to light stimulus and W being the maximum response to waves) for cells from the functional clusters defined in Figure 2. Light intensity: 107 photons μm−2 s−1. Only the light-responsive cells from WT mice are shown. *p < 0.05; ***p < 0.0005; Student's t test with Bonferroni correction. Not significant (p = 0.22). N values are given in F. I, Average interwave time intervals from different FOV in retinas from Control and TrpC 6/7 KO mice. p = 0.52 (two-sample t test). J, The distributions of ΔF/F responses to retinal waves were not significantly different between non–light-responsive cells from Control and TrpC 6/7 KO retinas (p = 0.13, two-sample t test). K, The proportion of non–light-responsive cells participating in retinal waves was indistinguishable between Control and TrpC 6/7 KO retinas (p = 0.61, χ2 test). L, Light selectivity index in Control (1:1 C129:C57BL6/J; n = 9 FOV from 3 mice) and TrpC 6/7 KO (n = 6 FOV from 2 mice) retinas, at four different light intensities. **p < 0.005; ***p < 0.0005; Wilcoxon rank-sum test with Bonferroni correction.
