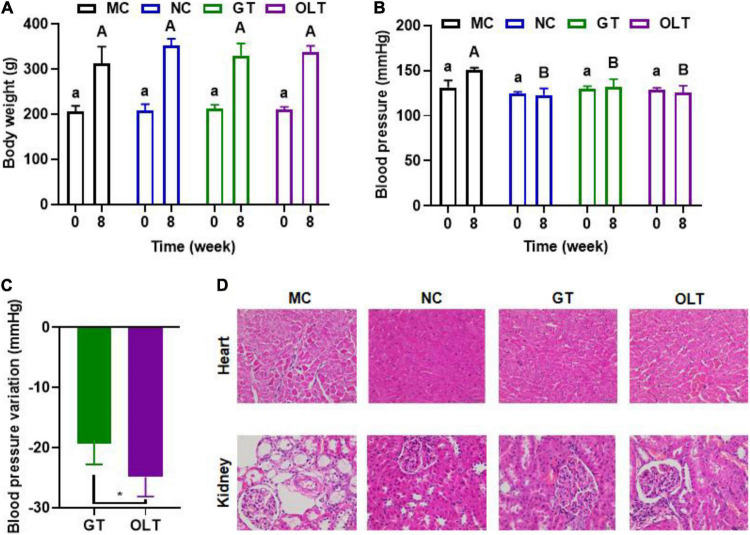
FIGURE 1.
GT and OLT affected the body weight, blood pressure, and tissue condition. (A) Body weight. (B) Blood pressure. (C) Blood pressure variation after GT and OLT supplementation, (D) Histological analysis of heart and kidneys. Different uppercase or lowercase letters represent a significant difference among multiple groups (p < 0.05). Asterisk represent a significant difference between groups. *p < 0.05. One-way ANOVA analysis followed by a Tukey test was employed to estimate the statistical significance.

