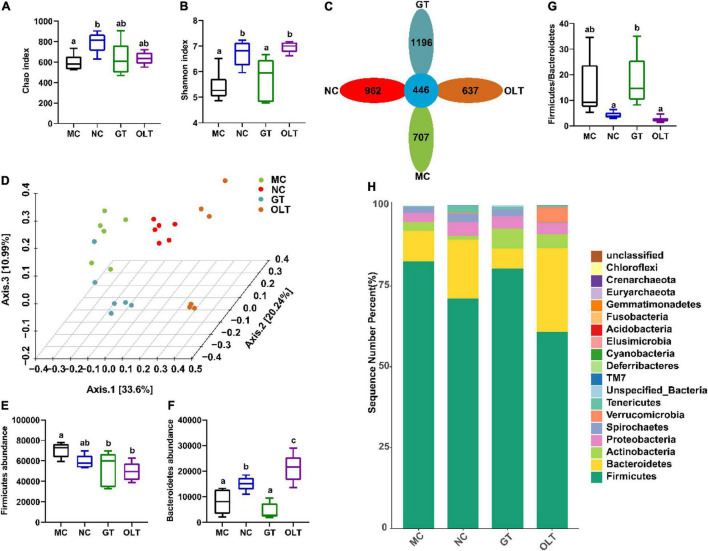
FIGURE 3.
GT and OLT altered the gut microbial diversity and composition at the phylum level in rats induced by a high-salt diet. (A) Chao index reflects species richness (the number of species). (B) Shannon index assessing the species diversity. (C) Flower diagram of OTUs, the petals are the number of OTUs unique to the corresponding group, and the center is the number of mutual OTUs of all groups. (D) 3D PCoA analysis based on Bray Curtis distance, the percentage represents the contribution value of each principal component to the sample difference. (E) Firmicutes abundance at the phylum level. (F) Bacteroidetes abundance at the phylum level. (G) The ratio of Firmicutes to Bacteroidetes. (H) Histogram of the relative distribution of gut microbes at the phylum level. One-way ANOVA analysis followed by a Tukey test was employed to estimate the statistical significance. The different letters represent significant differences between different groups (p < 0.05).

