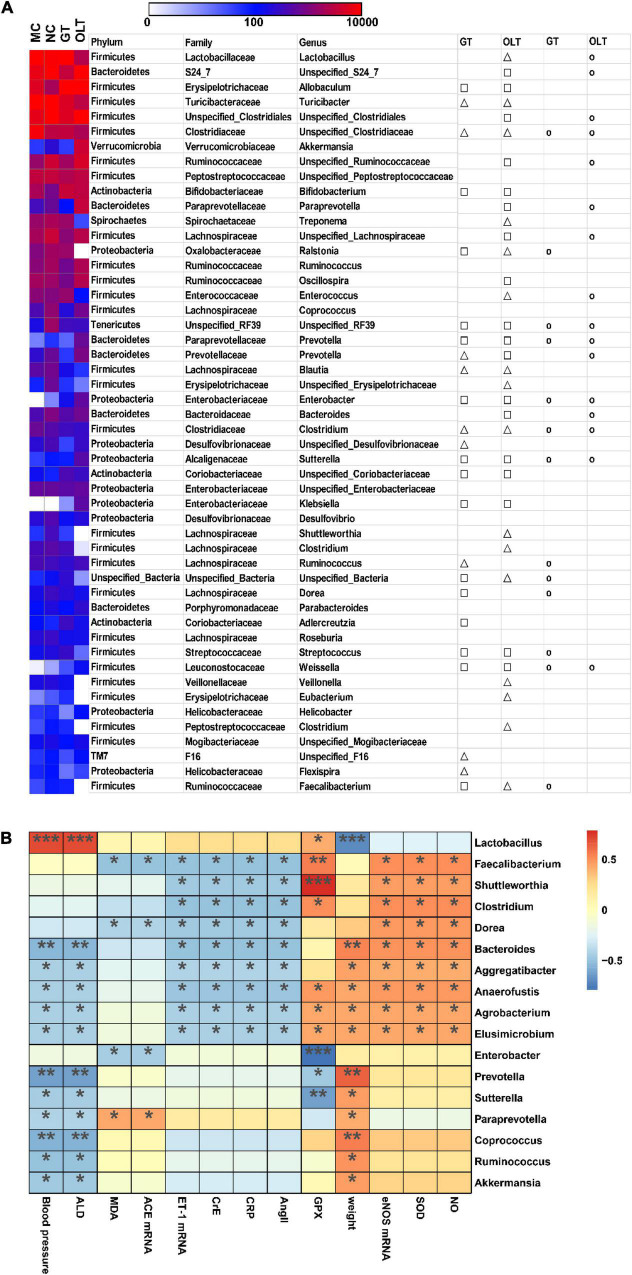
FIGURE 6.
GT or OLT treatment reversed the imbalance of intestinal flora abundance of rats caused by a high-salt diet. (A) Heatmap in the abundance of the top 50 OTUs of different treatment groups of high-salt fed rats. The triangle and square indicate the less and more relative abundances of OTUs in GT or OLT groups in comparison with the MC group, respectively. The circular indicates that the OTU of the NC group that was changed by hypertension was reversed by GT or OLT treatment. (B) Spearman correlation analysis between the microbial genera in the intestinal flora and related parameters of hypertension. The parameters related to blood pressure are on the X-axis, and the bacteria genera are on the Y-axis. The R-value is displayed in different colors, and the * sign indicates that there is a significant correlation between the two. *p < 0.05, **p < 0.01, ***p < 0.001.

