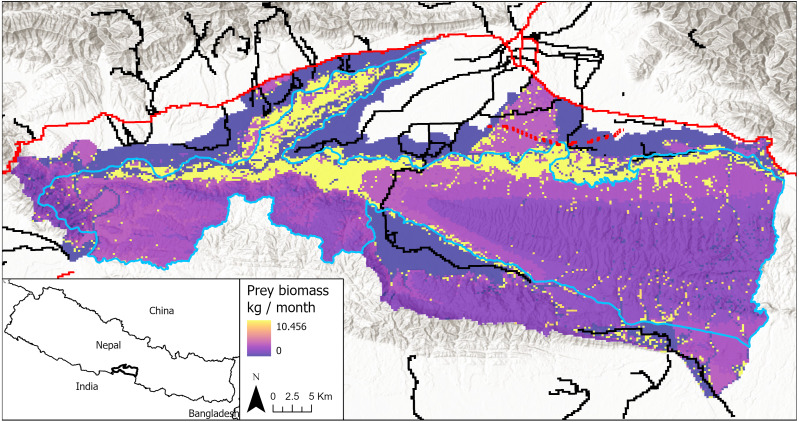
Figure 1. Study area in Chitwan, Nepal (83.8E, 27.7N; 84.8E, 27.3N), including both the national park and its buffer zone.
Park boundary in blue. Primary roads are shown in red and secondary roads in black. The proposed railway alignment through the park’s buffer zone is shown in red dash marks. Prey biomass production is shown for each cell in the model landscape, with darker colors being low prey resources and lighter colors being high prey resources, including yellow indicating grid cells with highest estimated prey abundances.

