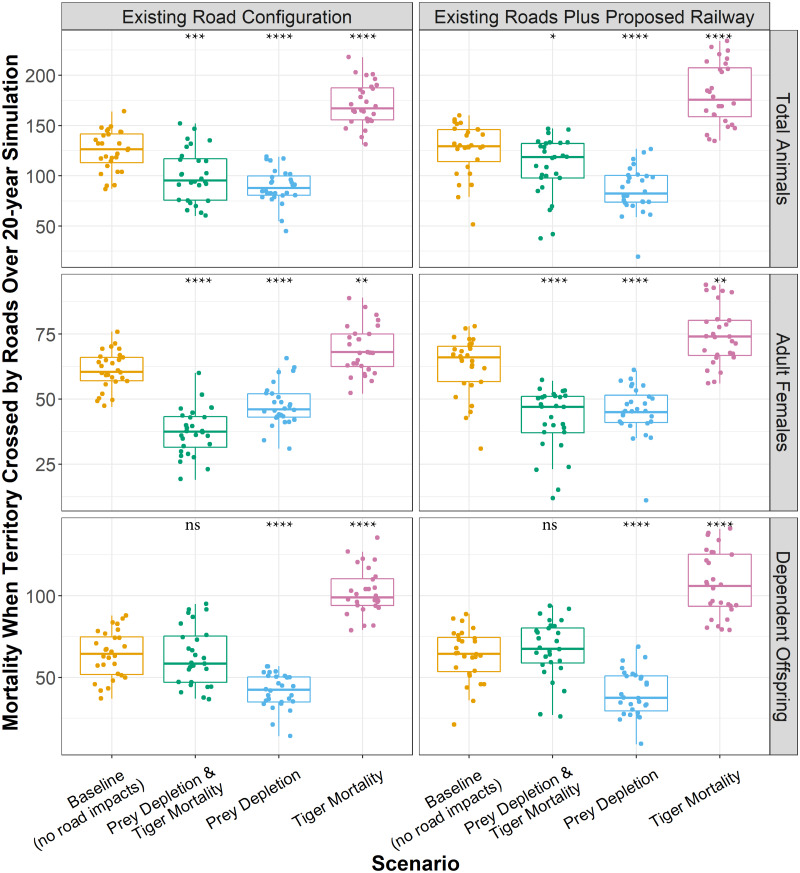
Figure 5. Total tiger mortalities along roads over 20 years.
Boxplots showing the number of tigers that died while their territory was crossed by transport infrastructure over 20 years for each model experiment. Boxplots represent the 25th and 75th percentiles of deaths across 28 model replicates. Each replicate is shown as point. Whiskers represent the 95% confidence intervals, and black lines within boxes represent medians. The means across replicates for each experiment were statistically compared against the baseline using Wilcoxon tests. ns: p > 0.05, *: p ≤ 0.05, **: p ≤ 0.01, ***: p ≤ 0.001. ****: p ≤ 0.0001.

