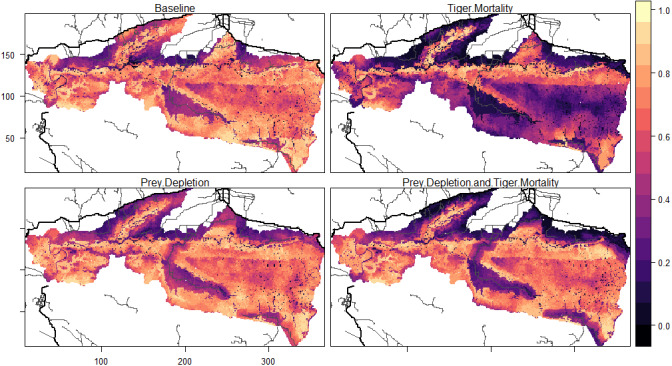
Figure 6. Patterns of tiger occupancy for each model experiment.

Values show the proportion of the 240 time steps in which a cell was occupied by an adult female tiger, averaged across 10 replicates. Darker colors represent lower values and brighter colors represent higher values. Primary roads are shown as thick black lines and secondary roads as thin black lines. The railway was not included in this analysis. The X, Y dimensions are model coordinates not geographic coordinates.
