Figure 3.
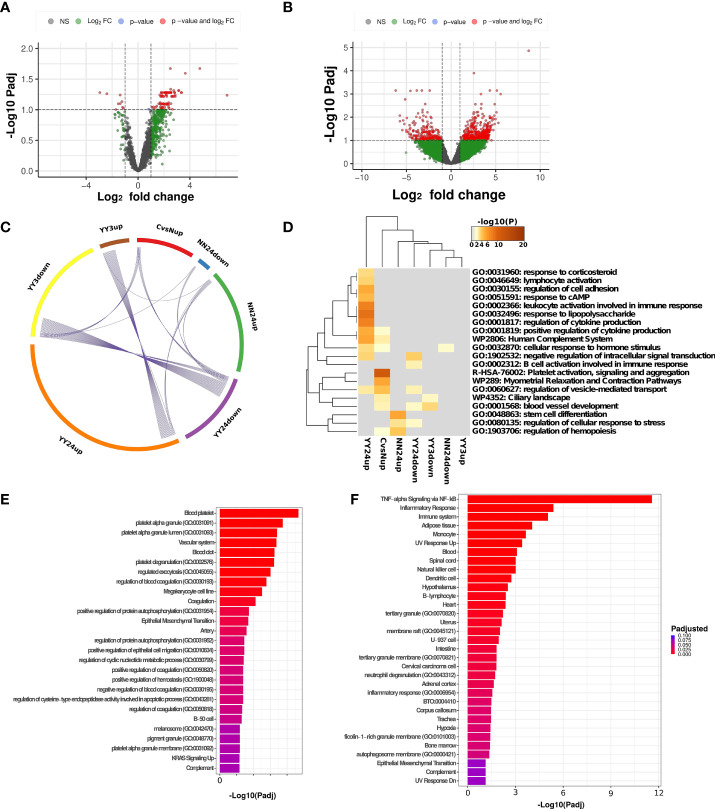
Differential expression analysis. (A) Volcano plot representing significantly differentially expressed genes in Cancer vs. Healthy patients at baseline. Genes are considered significant if they pass the FDR-corrected p-value of 0.1 and show an absolute fold difference of at least 2. (B) Volcano plot representing significantly differentially expressed genes in APG-treated Cancer patients after 24h vs. baseline. Genes are considered significant if they pass the FDR-corrected p-value of 0.1 and show an absolute fold difference of at least 2. (C) Overlap of differentially expressed genes (DEGs) between different comparisons and (D) heatmap showing the overlap in overrepresented terms between different comparisons. CvsNup = Cancer vs. Healthy patients before treatment, upregulated genes; YY3up/down APG-treated Cancer patients at 3h post-treatment vs. pre-treatment, up or downregulated genes; YY24up/down APG-treated Cancer patients at 24h post-treatment vs. pre-treatment, up or downregulated genes; NN24up/down Placebo-treated healthy patients at 24h post-treatment vs. pre-treatment, up or downregulated genes. (E) Bar plot showing the top most significantly enriched terms in cancer vs. healthy patients at baseline. The dataset is a combination of GO Biological Processes, GO cellular component, MsigDb and Jensen tissues databases. (F) Bar plot showing the top most significantly enriched terms in APG-treated cancer patients 24h post-treatment vs. pre-treatment. The dataset is a combination of GO Biological Processes, GO cellular component, MsigDb and Jensen tissues databases.

