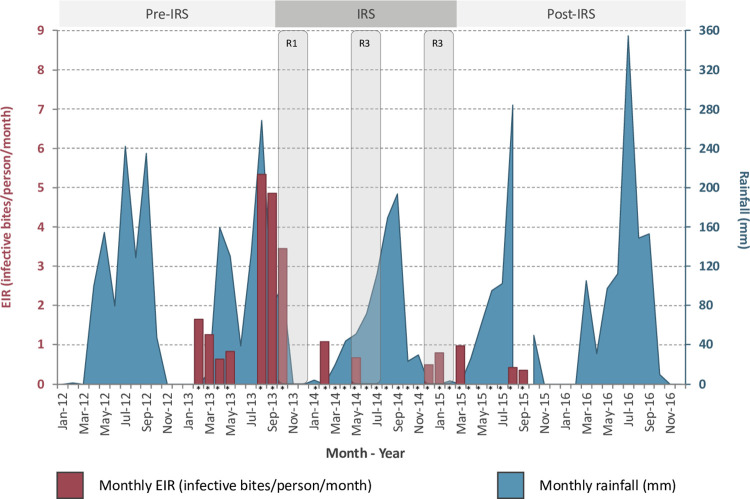
Fig 2. Entomological and rainfall data between 2012 and 2016.
Monthly variation in the entomological inoculation rate (EIR-monthly = infective bites/person/month) (red) of Anopheles spp. in Bongo, Ghana in relation the three-rounds of IRS (Round 1 (R1), Round 2 (R2) and Round 3 (R3)). The asterisks (*) denote the months when the entomology surveys were completed. Due to logistical challenges, there were gaps in the monthly monitoring, however a total of 28 out of 31 months (90.3%) were covered. Since no meteorological data was available for Bongo District, the monthly rainfall data (mm) (blue) between January 2012 to December 2016 was acquired from the closest meteorological station based in Bolgatanga (~15 km south of Bongo Town by “birds flight”). The grey shading indicates the timing of the three-rounds of IRS (R1, R2, R3) between 2013–2015.

