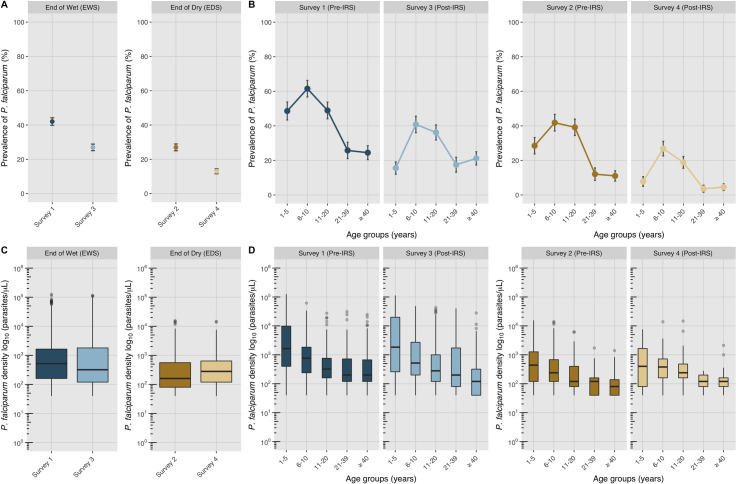
Fig 3. Reductions in the prevalence and density of microscopic P. falciparum infections pre- to post-IRS at the end of the wet (blue) and dry (gold) seasons.
Prevalence of microscopic P. falciparum infections pre- to post-IRS at the A. end of the wet and dry season surveys and B. across each age group (years) at the end of the wet and dry season surveys pre- to post-IRS. Error bars represent the upper and lower limits of the 95% confidence interval (CI). Box and whisker plots of the log10-transformed microscopic P. falciparum infection densities (parasites/μL) pre- to post-IRS at the C. end of the wet and dry season surveys and D. across each age group (years) at the end of the wet and dry season surveys. The boxes represent the inter-quartile ranges (IQR) and the horizontal lines represent the median log10-transformed P. falciparum infection densities (parasites/μL). The whiskers are used to depict the largest and smallest log10-transformed infection densities and the grey dots outside the whiskers are used to denote outliers. The parasite densities were log10-transformed to remove skewness. For additional details see S4 Table.

